Rain Season Lacking
This rain year was dry for much of the viewing area and slightly wet around the Monterey Peninsula. We were dry to start out, had a wet December, dry January/February, but even with a wet March and early April, we couldn't quite catch up! Now, it's the dry season and outside of occasional coastal drizzle, we won't see much if any rain until the fall.
Since the summer is the dry season, it's a natural break point for our rain year. That's why we use a calendar year starting on July 1st and ending on June 30th. Every day, the Weather Authority team records rainfall data from 56 locations around our viewing area. We do this in an effort to get the most complete picture of precipitation as possible as there are only 5-10 regularly reporting official climate sites within our three and half county coverage area.
We source a variety of observations ranging from official governmental climate sites, other scientifically maintained networks, all the way down to backyard weather stations. Our team vets the data to the best of our meteorological ability, throwing out any bad/questionable results. Some locations like Parkfield only have one data point, whereas Santa Cruz may include as many as thirty. The data is then averaged for each location and recorded daily. For example, if a thunderstorm dropped one inch of rain on the west side of Santa Cruz but left the east side dry, the daily average would likely be somewhere in between--maybe close to a half an inch and that's what would be recorded.
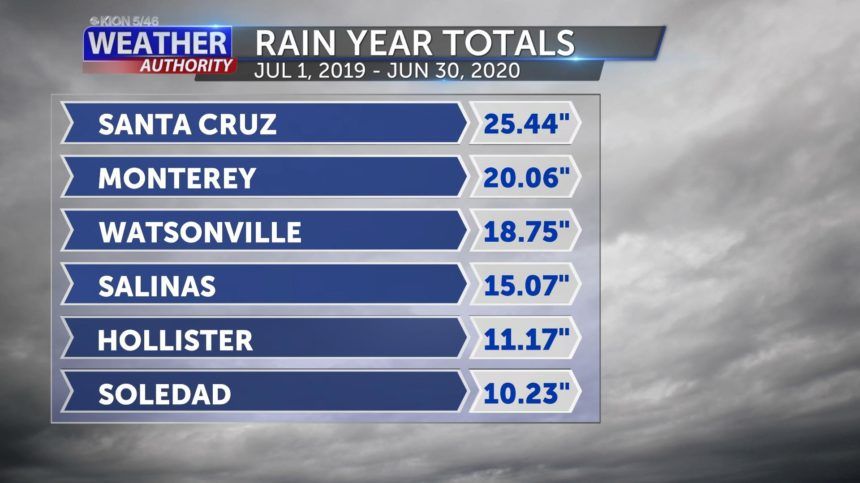
Listed below are this rain year's totals ordered from wettest to driest.
| 35.47" | Bonny Doon |
| 34.01" | Felton |
| 33.79" | Ben Lomond |
| 31.56" | Big Sur |
| 31.41" | Day Valley |
| 30.33" | Scotts Valley |
| 28.76" | Boulder Creek |
| 28.00" | Lompico |
| 27.31" | Live Oak |
| 27.24" | Hwy 17 Summit Area |
| 26.92" | Carmel Highlands |
| 26.37" | Soquel |
| 26.24" | Capitola |
| 25.44" | Santa Cruz |
| 25.44" | Corralitos |
| 24.38" | Aptos |
| 21.47" | Carmel |
| 21.39" | Rio Del Mar |
| 20.72" | La Selva Beach |
| 20.61" | Pacific Grove |
| 20.48" | Pebble Beach |
| 20.34" | Aromas |
| 20.06" | Monterey |
| 19.14"* | Davenport |
| 18.75" | Watsonville |
| 18.15" | Prunedale |
| 17.79" | Carmel Valley |
| 17.17" | Seaside |
| 16.92" | Gilroy |
| 16.74" | Arroyo Seco |
| 16.19" | San Antonio Valley |
| 15.56" | Moss Landing |
| 15.40" | Marina |
| 15.27" | Castroville |
| 15.07" | Salinas |
| 15.03" | Hernandez Valley |
| 14.96" | San Martin |
| 14.68" | Morgan Hill |
| 13.73" | Toro Valley |
| 13.42" | San Juan Bautista |
| 12.82"* | Las Lomas |
| 12.46" | Pinnacles NP |
| 11.17" | Hollister |
| 11.17" | Parkfield |
| 11.00" | King City |
| 10.92" | Gonzales |
| 10.77" | Chualar |
| 10.24" | Paicines |
| 10.23" | Soledad |
| 10.18" | Greenfield |
| 9.99" | San Lucas |
| 9.94" | Bradley |
| 9.73"* | Bitterwater |
| 7.77" | San Ardo |
*Missing one more more days of data
**Keep in mind that the totals listed above may differ from the official climate records as multiple data points are used for most cities.
UPDATED TO ADD:
For the sake of comparison, check out this listing of average annual rainfall*** for various climate sites across the area:
Monterey Airport: 16.12"
Salinas Airport: 12.83"
Ben Lomond: 50.48"
Big Sur Station: 44.88"
Carmel Valley: 19.36"
Gilroy: 20.54"
Hollister: 14.19"
King City: 12.06"
Santa Cruz: 31.35"
Watsonville Waterworks: 23.50"
***listed as "normal total precipitation" from the NOAA Regional Climate Center xmACIS2 database.