These regions see the worst wildfires
David McNew // Getty Images
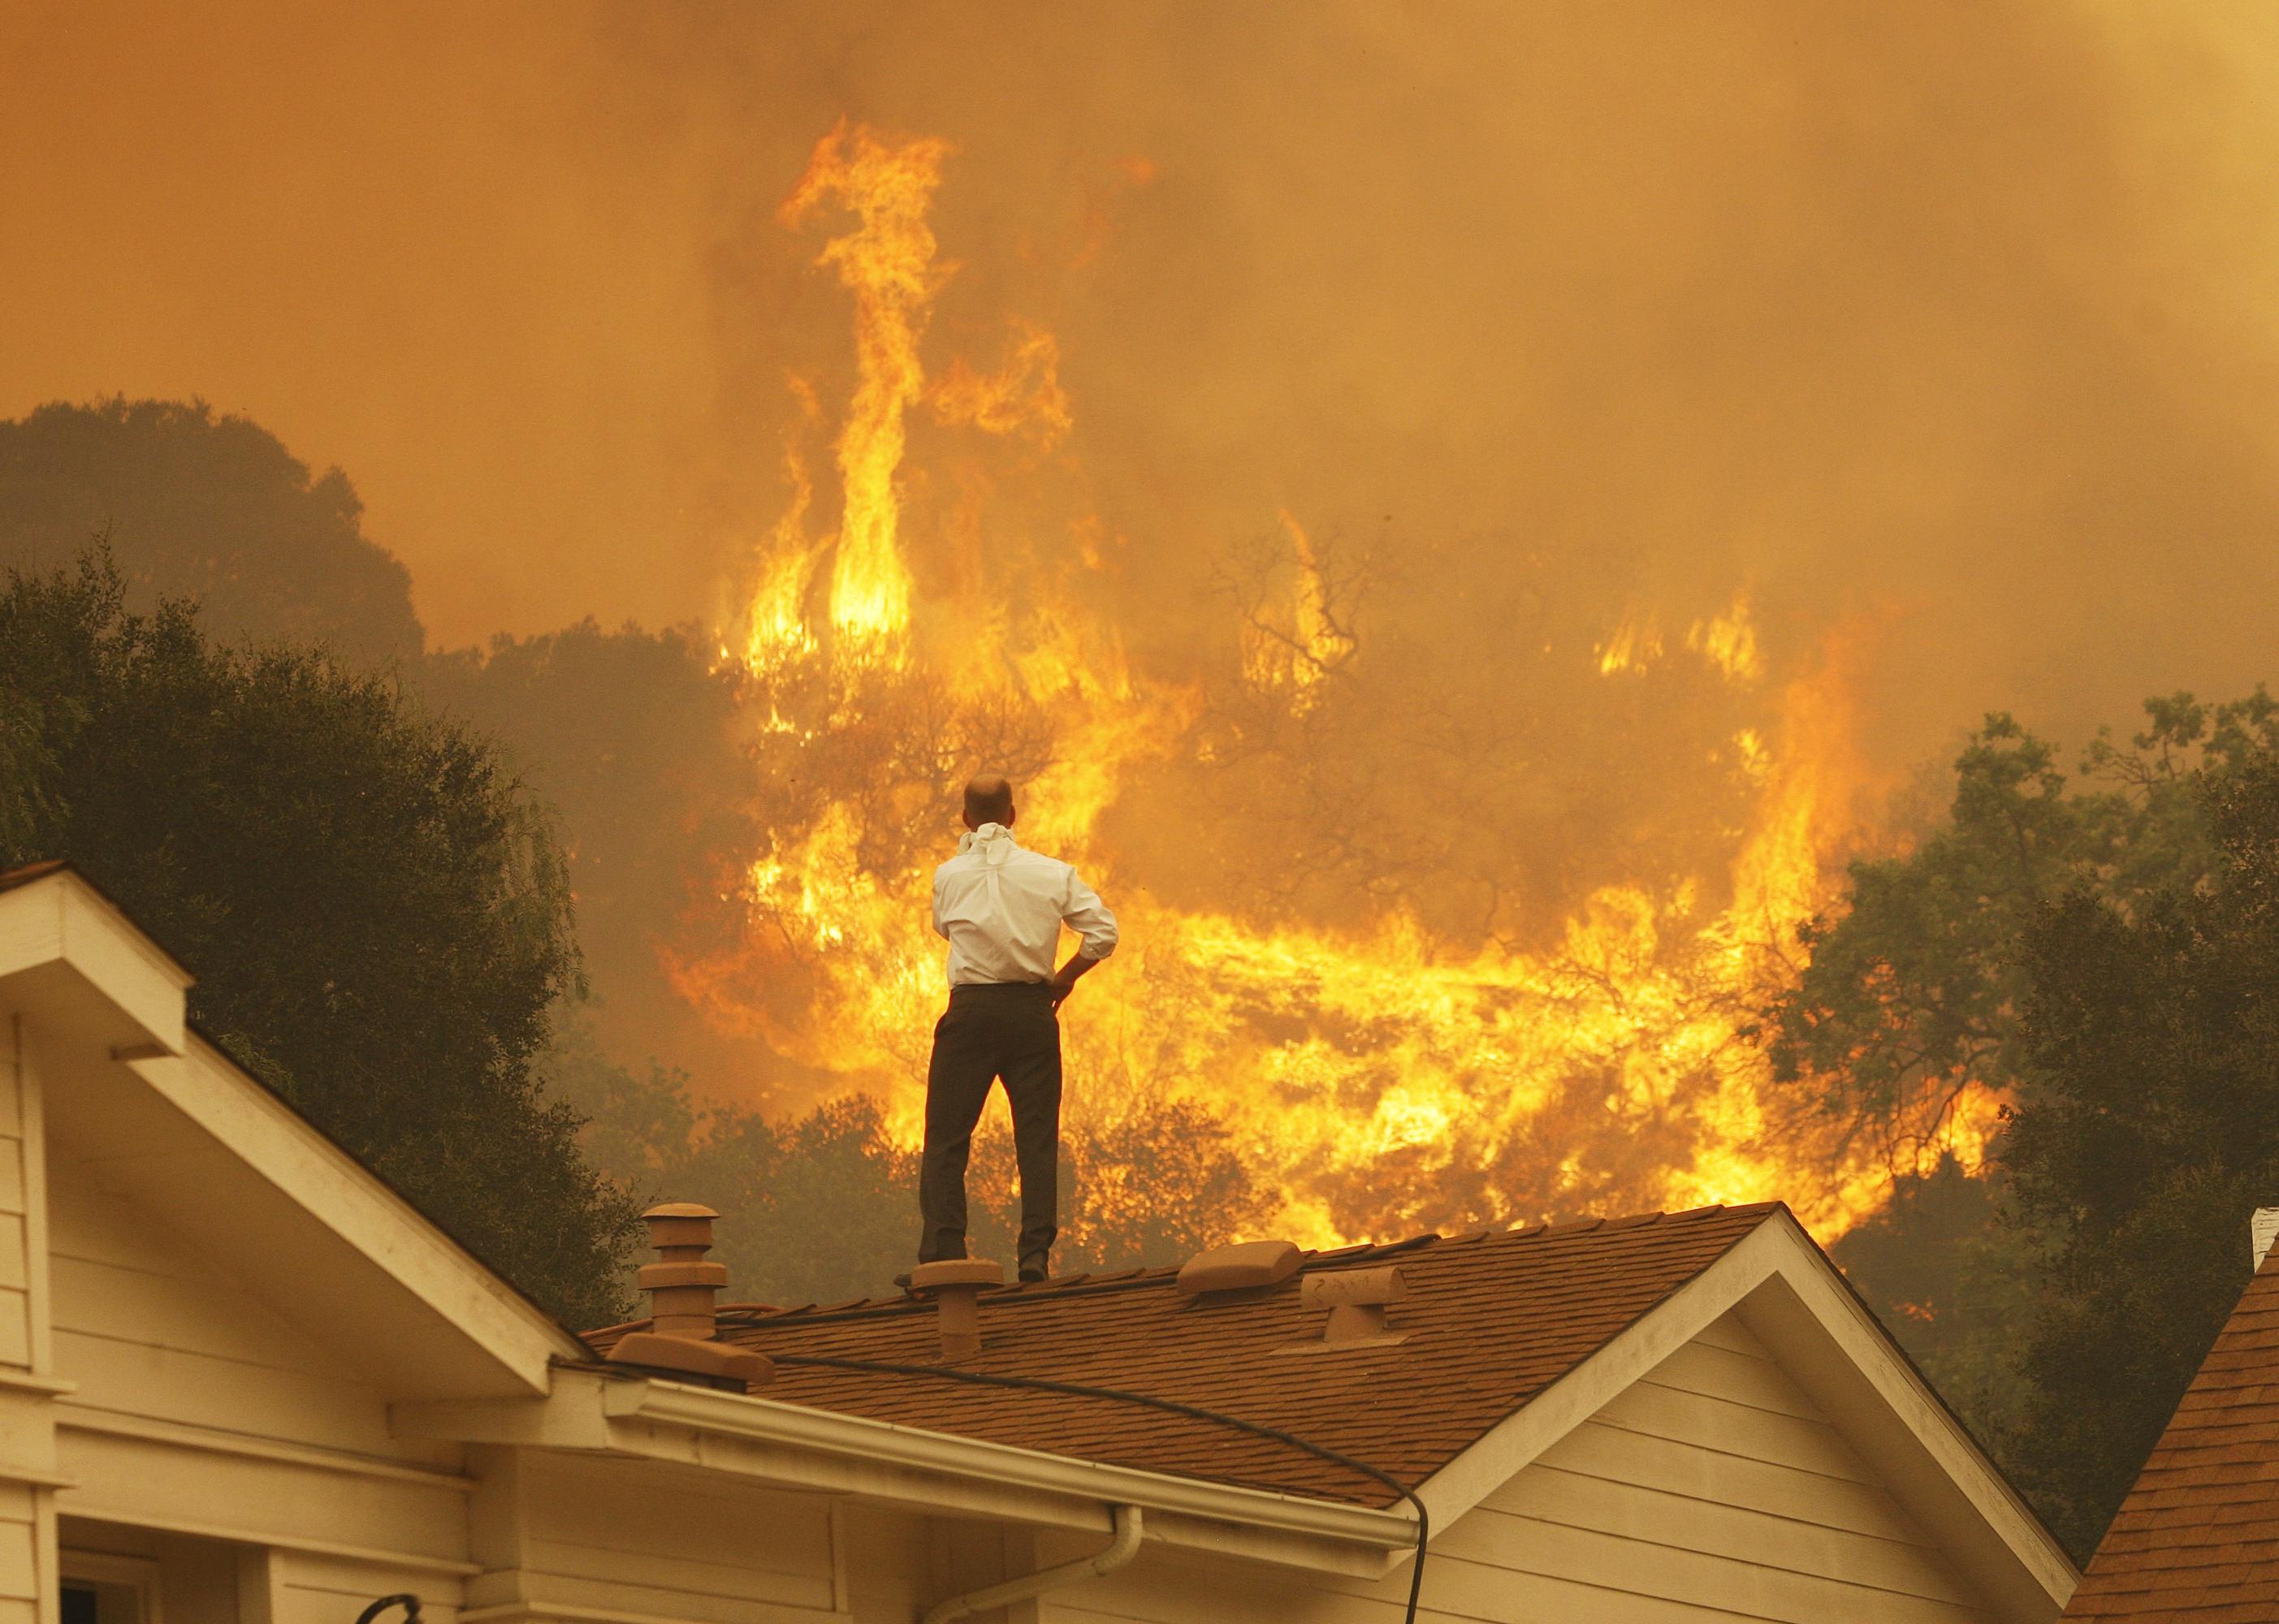
These regions see the worst wildfires
A man on a rooftop looks at approaching flames.
Wildfires are critical to maintaining a healthy, balanced ecosystem. They keep diseases and harmful pests at bay; clear dead, unhealthy, or overgrown vegetation, promoting new growth and habitats; and fortify the soil with vital nutrients. Some species, like pyrophytic plants, have adapted to naturally occurring, low-severity fires and even depend on wildfires in order to propagate. Each one of these benefits has countless, far-reaching impacts of its own.
But human activity, negligence, and anthropogenic-driven climate change are disrupting the natural fire ecology in many regions. Although some wildfires occur naturally—those caused by lightning strikes, for example—the vast majority of wildfires do not. Between 2018 and 2022, 89% of wildfires were the result of human activity.
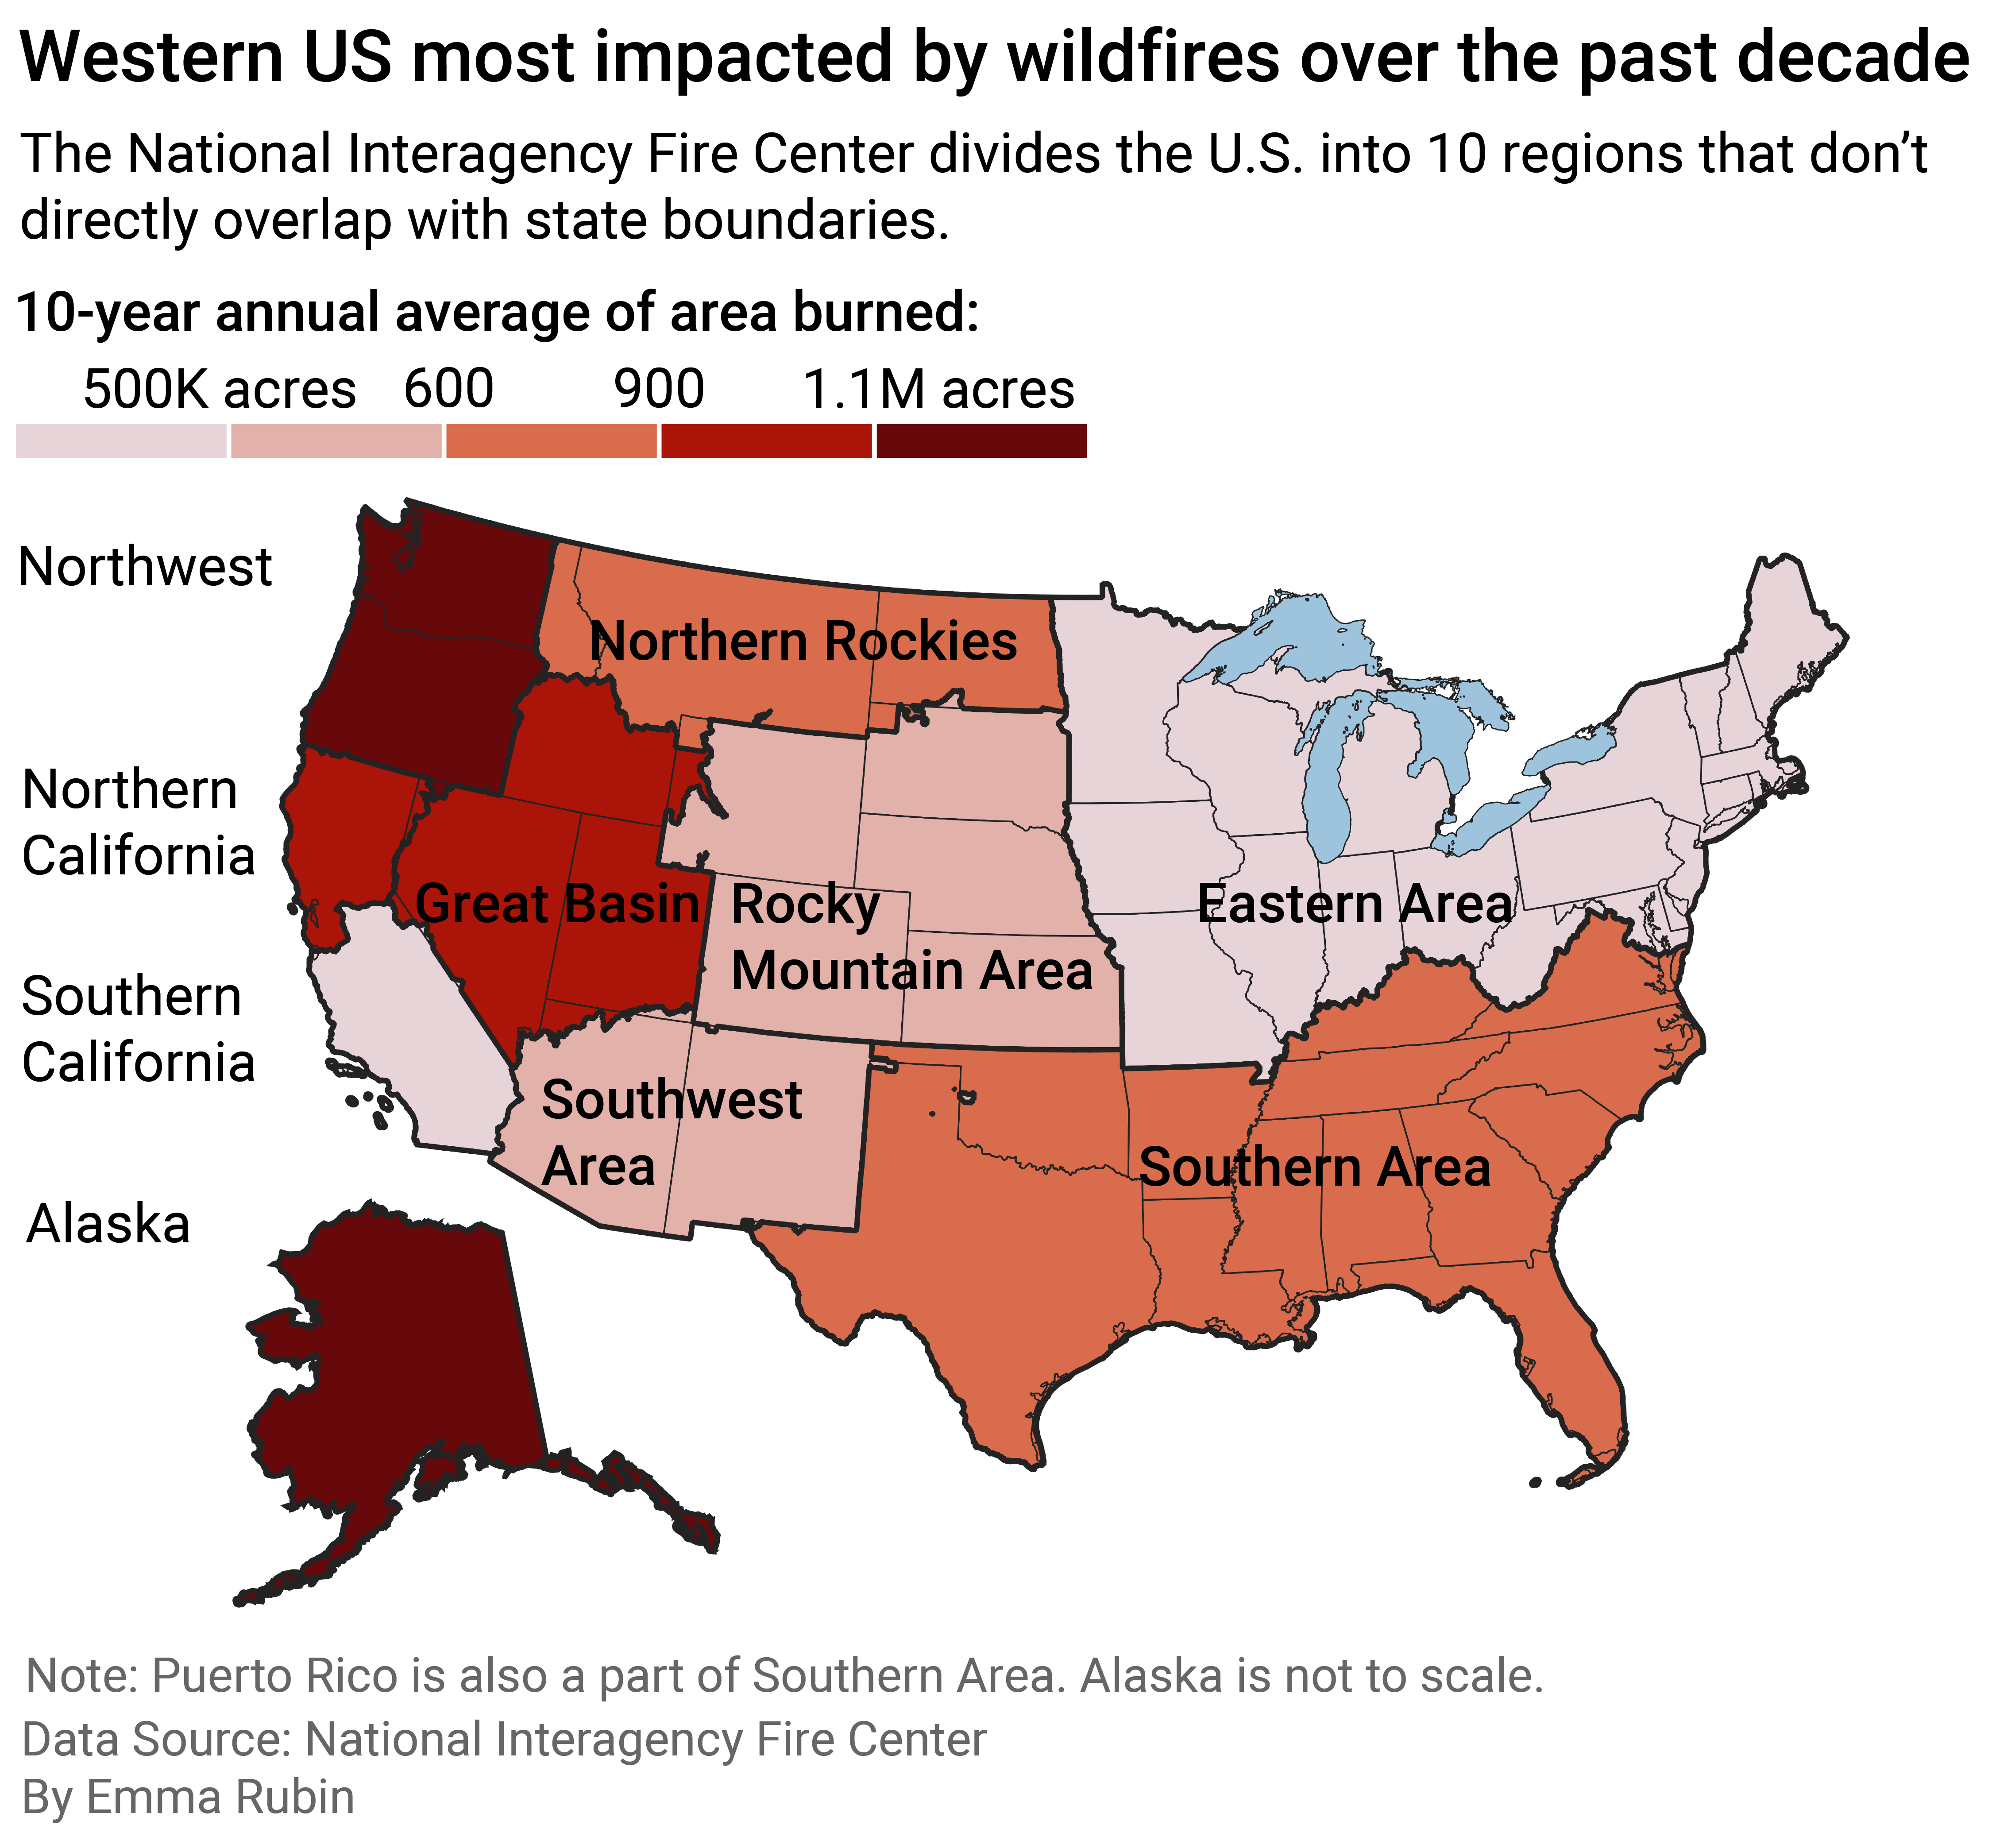
Insurify cited data from the National Interagency Fire Center to identify which regions have experienced the worst wildfires over the past decade and highlight how 2022 compared. States are ranked by the 10-year average of acreage burned per wildfire.
![]()
Insurify
Wildfires are increasing in intensity
Map showing western US reports the most wildfire damage based on acres burned over the past decade. Fire regions do not directly line up with state boundaries.
Periods of extreme heat and prolonged drought are leading to larger, more destructive fires, though not a greater number of them compared to several decades ago. Since 2000, on average, 70,025 wildfires have burned 7 million acres each year across the country — more than double the annual average of 3.3 million acres in the 1990s, when a greater number of fires occurred each year.
Changing fire ecologies vary from region to region. Factors such as the wildfire season starting earlier in the year (often coinciding with high seasonal winds) and severe drought in rangelands and shrublands (which essentially turns the landscape into tinder) greatly influence fire ecologies.
PHILIP PACHECO // Getty Images
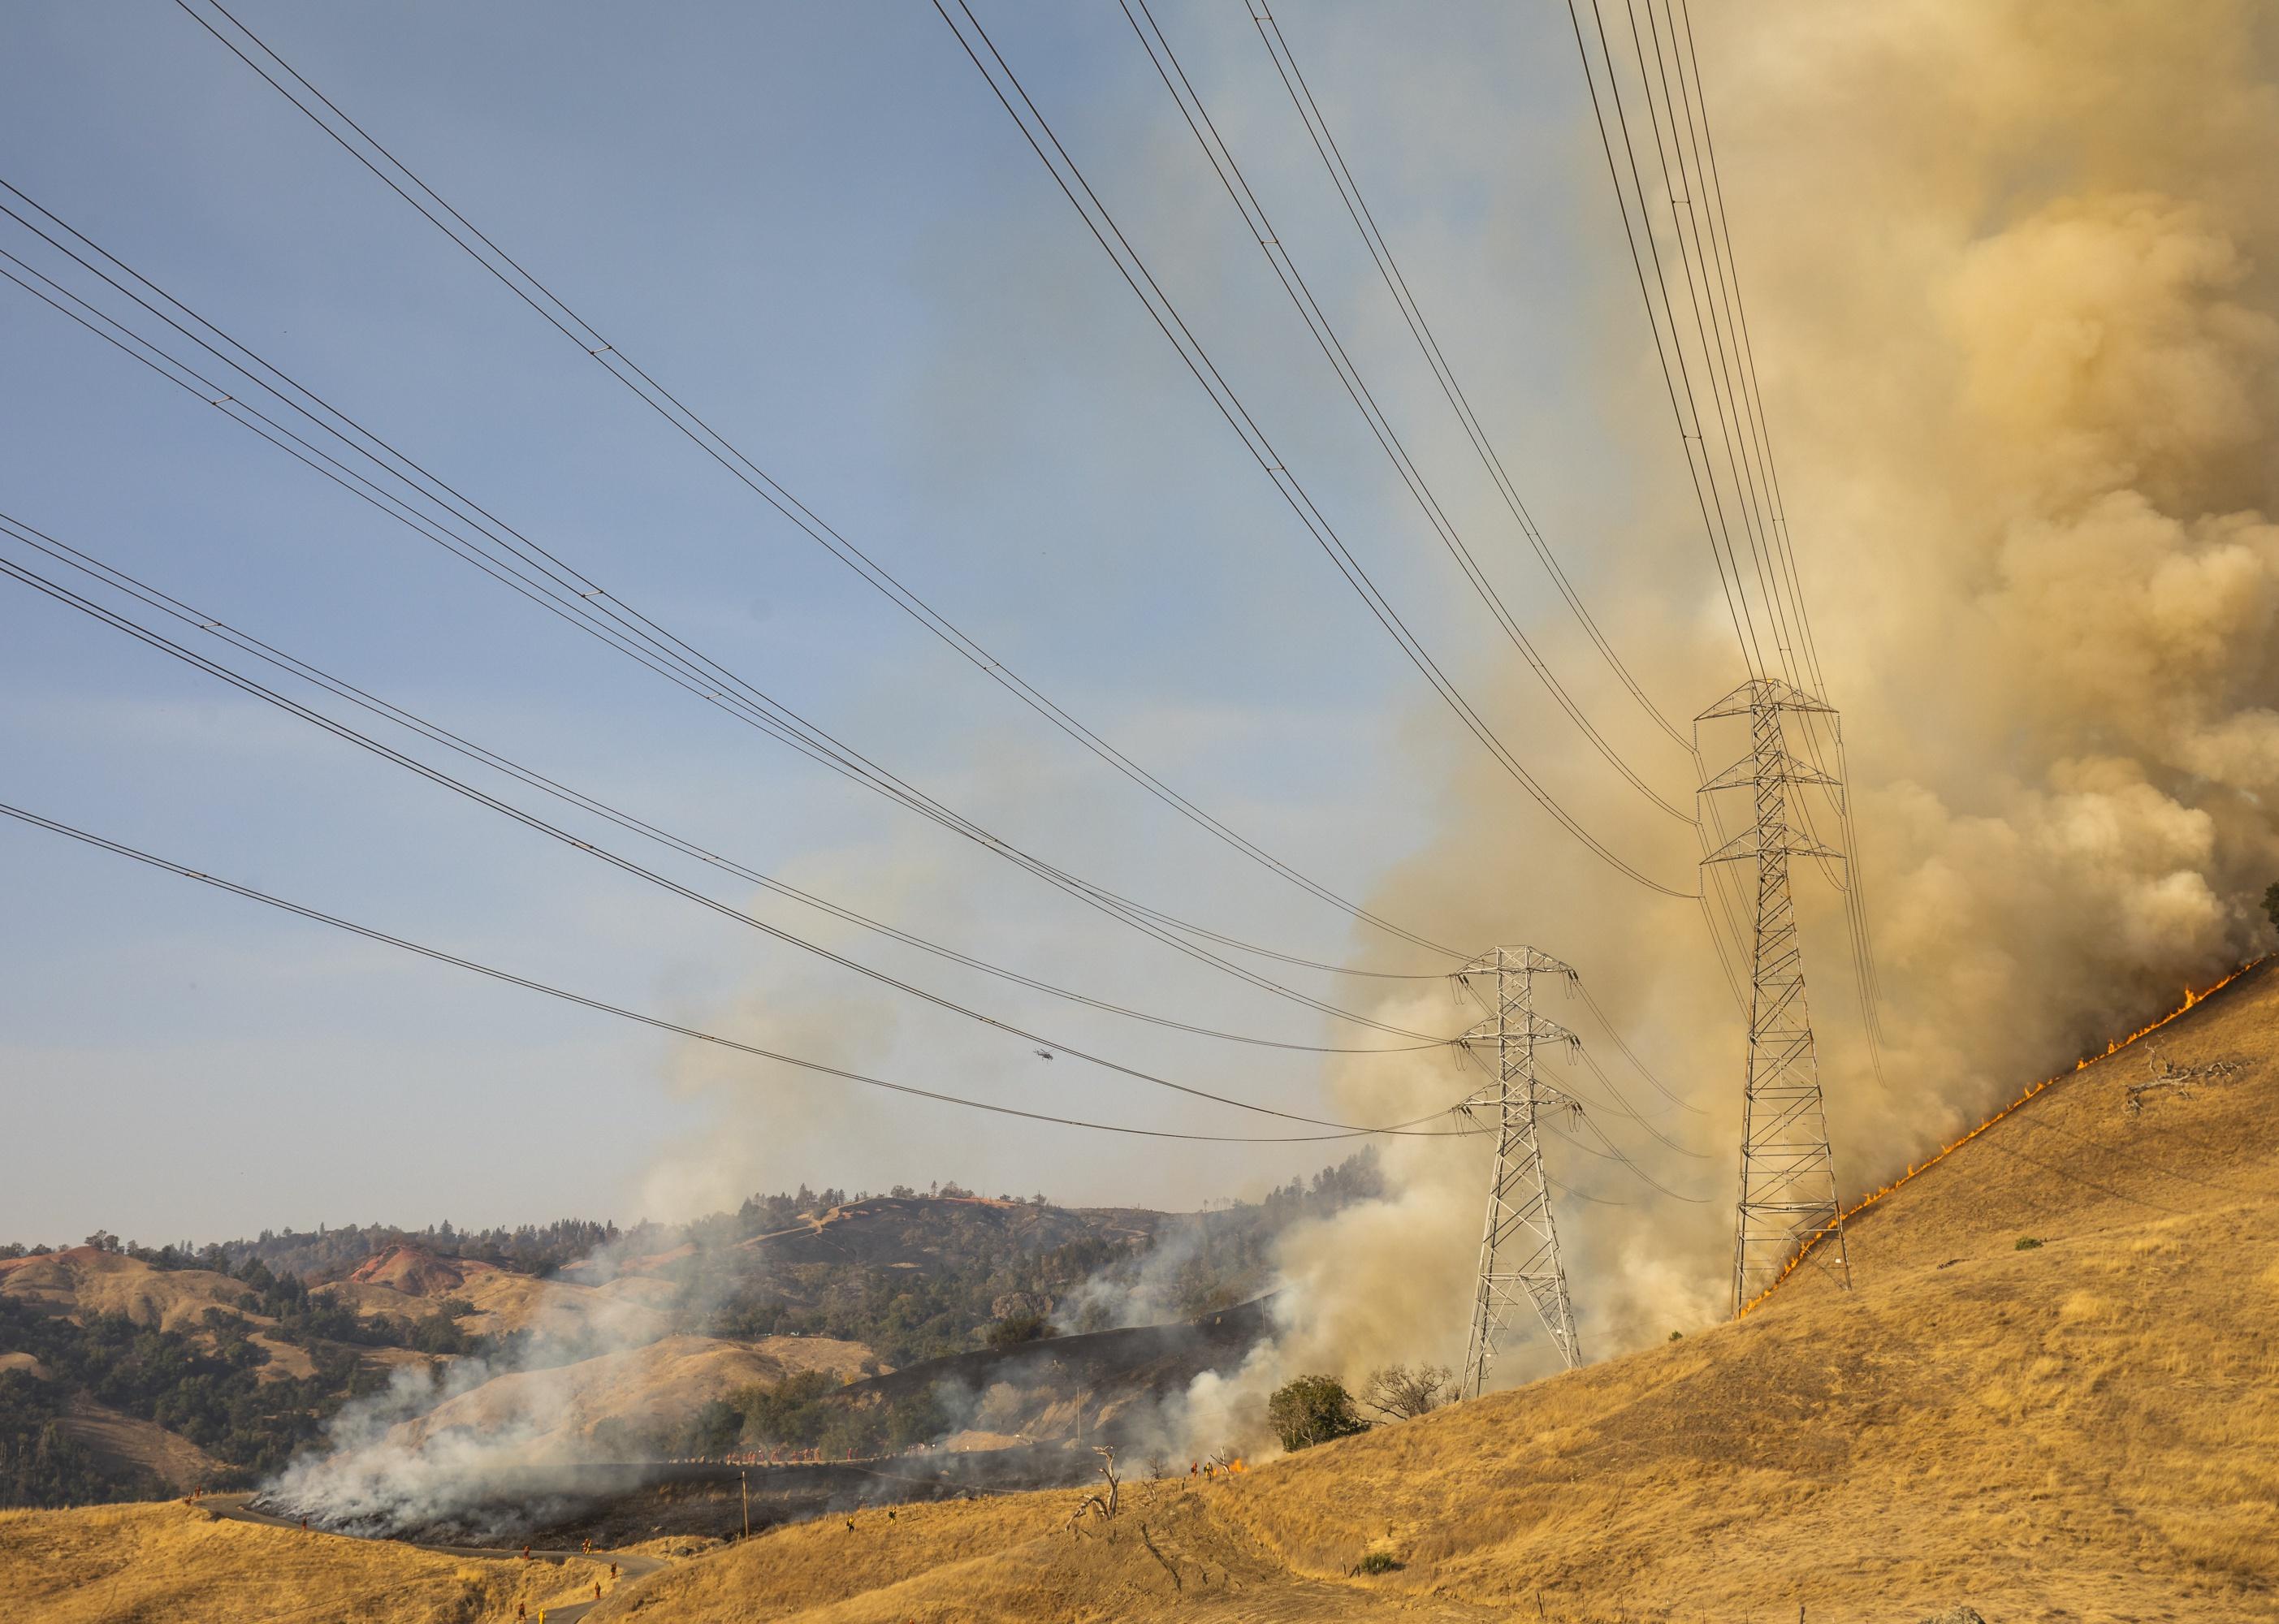
#10. Northern California area
A fire burns a hillside behind PG&E power lines.
– 10-year average
— Area burned: 921,091 acres
— Number of fires: 4,099
— Area per fire: 8.2 acres
– 2022 numbers
— Acres burned: 246,990 acres (73.2% less than 10-year average)
— Number of fires: 3,429 (16.3% less than 10-year average)
— Area per fire: 72.0 acres (779.5% greater 10-year average)
– Worst year of the decade: 2020 (2.8 million acres)
Driven by extreme heat and extended drought conditions, seven of California’s 10 largest wildfires on record have happened within the past five years. Ten of the state’s top 20 most destructive fires have also happened within the last five years and have burned a cumulative area of land roughly the size of Connecticut.
Education Images // Getty Images
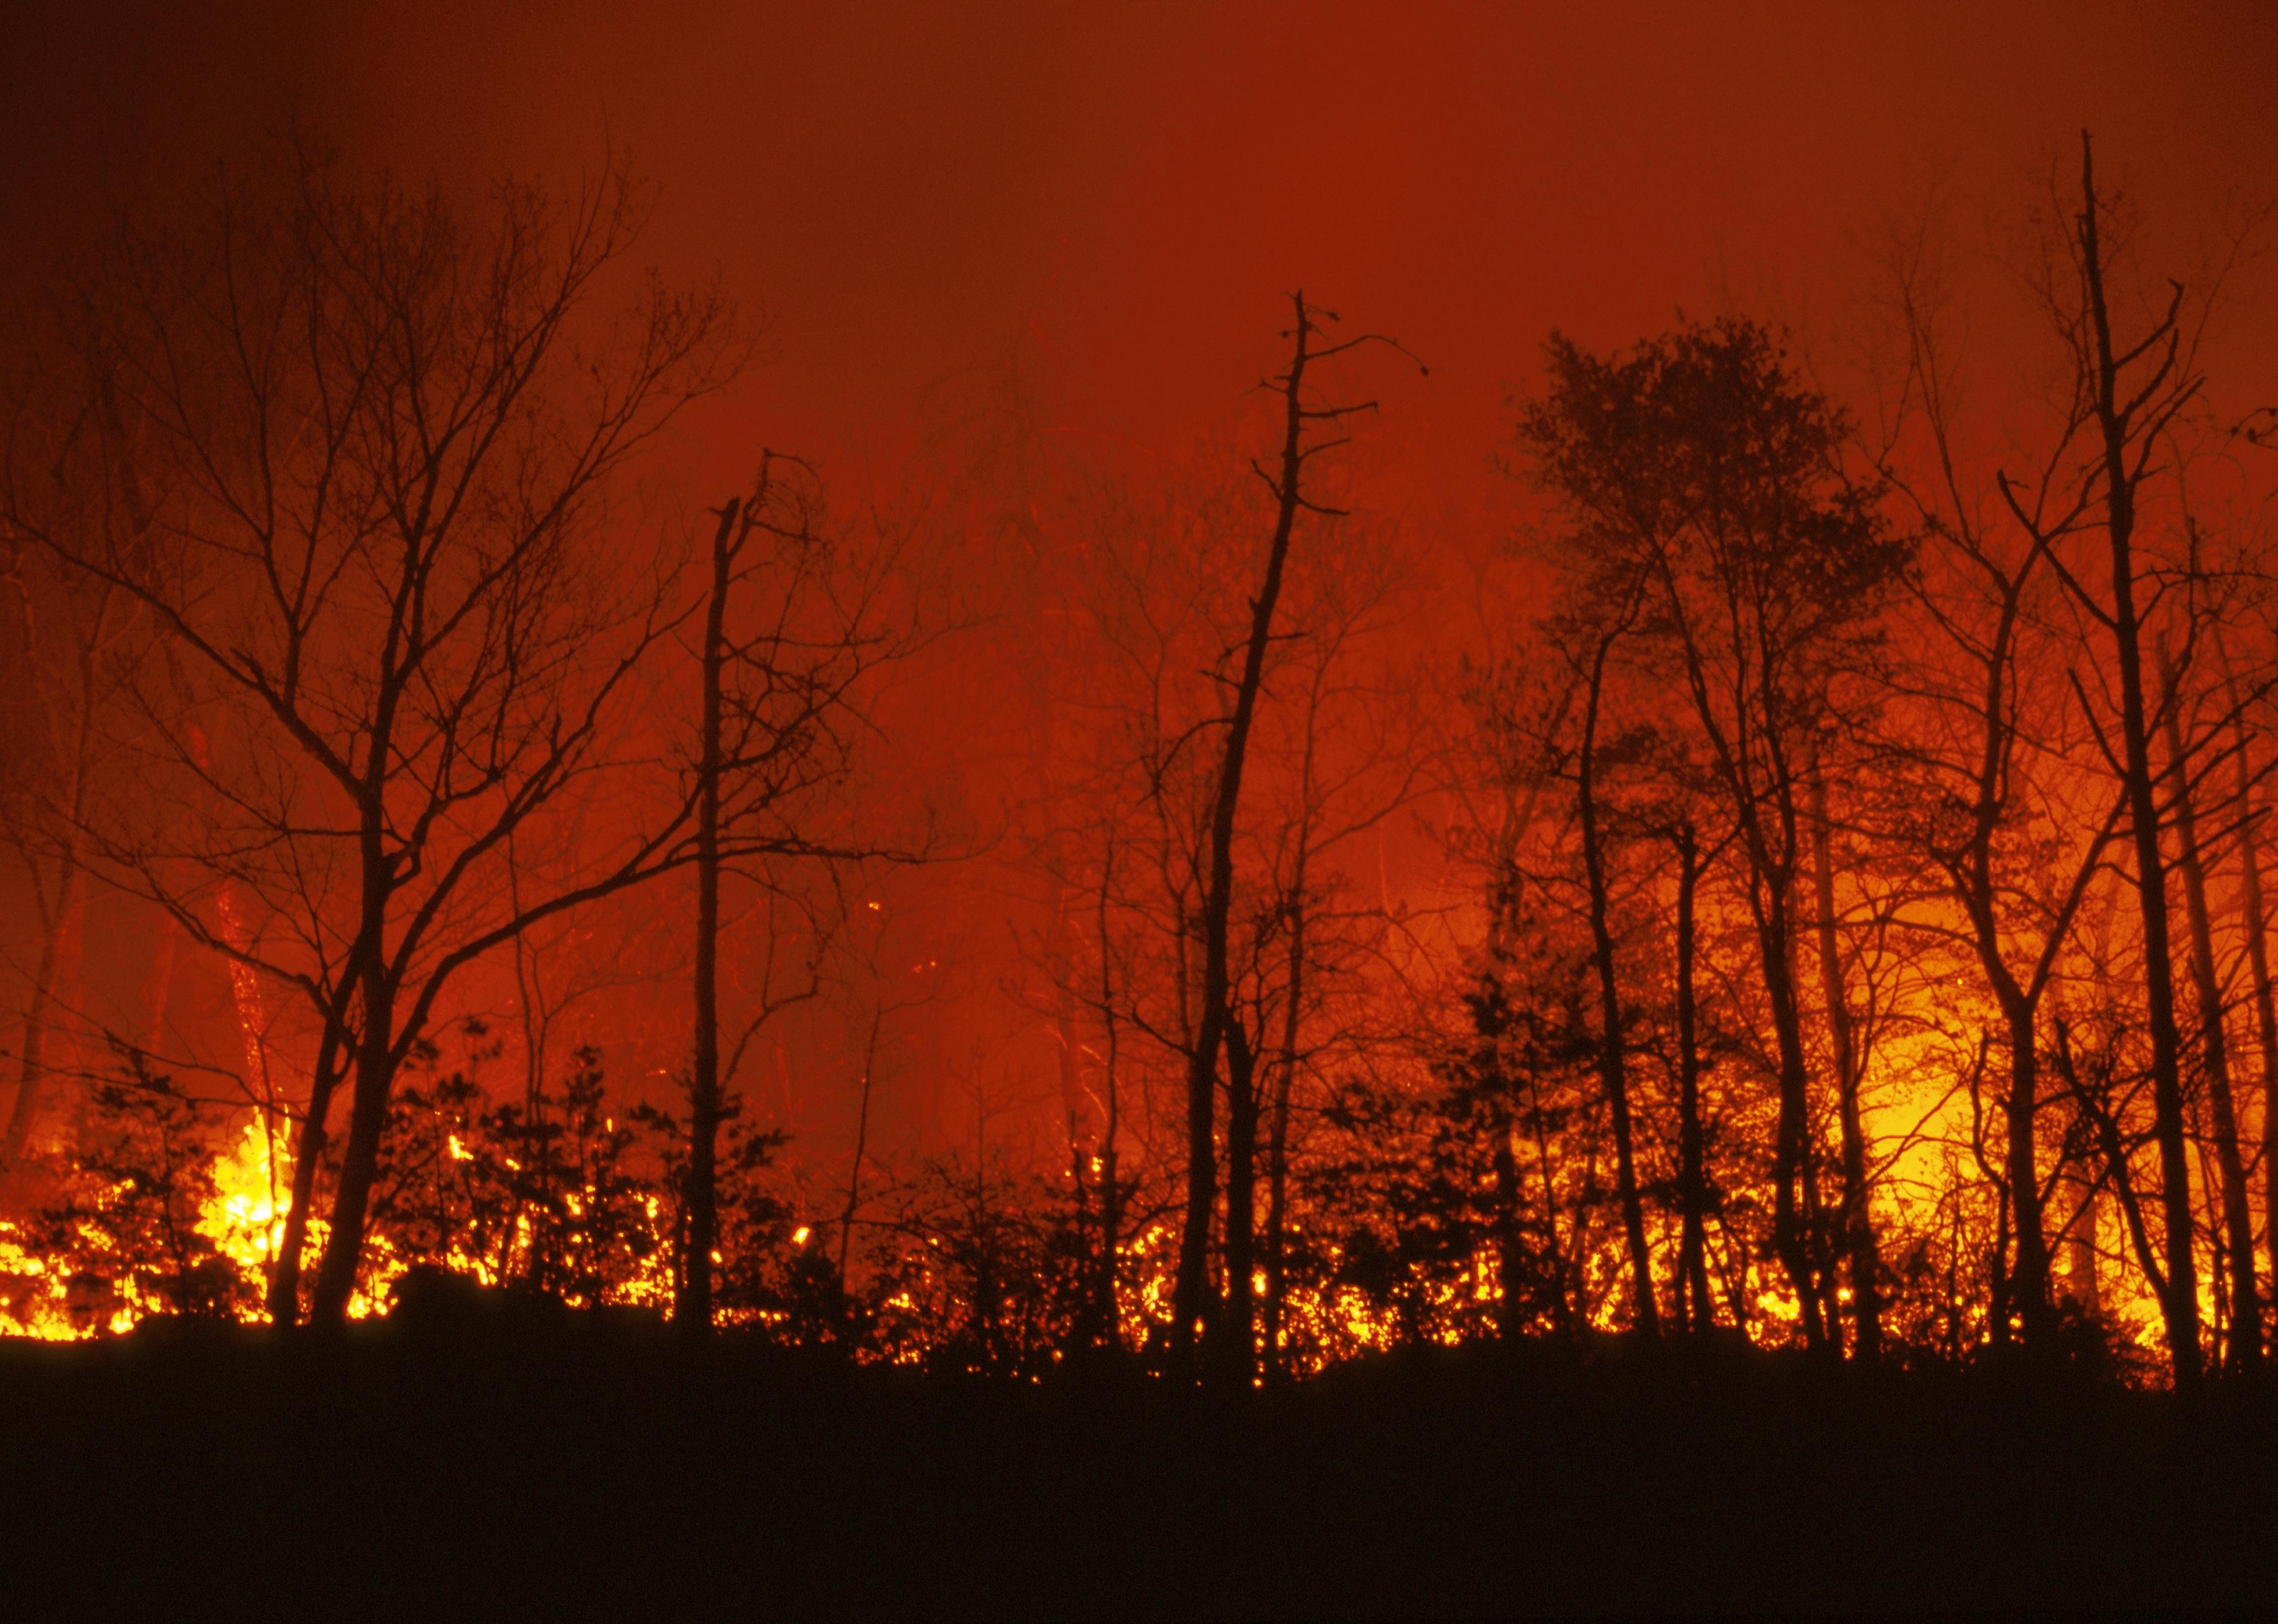
#9. Eastern area
Forest fire burns in the hillside of Virginia’s Rockbridge County.
– 10-year average
— Area burned: 81,067 acres
— Number of fires: 9,468
— Area per fire: 8.4 acres
– 2022 numbers
— Acres burned: 64,342 acres (20.6% less than 10-year average)
— Number of fires: 8,592 (9.3% less than 10-year average)
— Area per fire: 7.5 acres (10.4% less than 10-year average)
– Worst year of the decade: 2021 (152,669 acres)
The Eastern area of the U.S. includes 20 states between Maine and Minnesota and those as far south as Missouri, West Virginia, and Maryland. As in the West, the Eastern area has also been impacted by drought and extreme heat. The East actually experiences more wildfires than the West; however, they’re usually much smaller and less severe. In 2022, roughly 20,000 wildfires burned approximately 5.8 million acres in the West, compared to more than 48,000 fires that burned under 2 million acres in the East.
George Frey // Getty Images
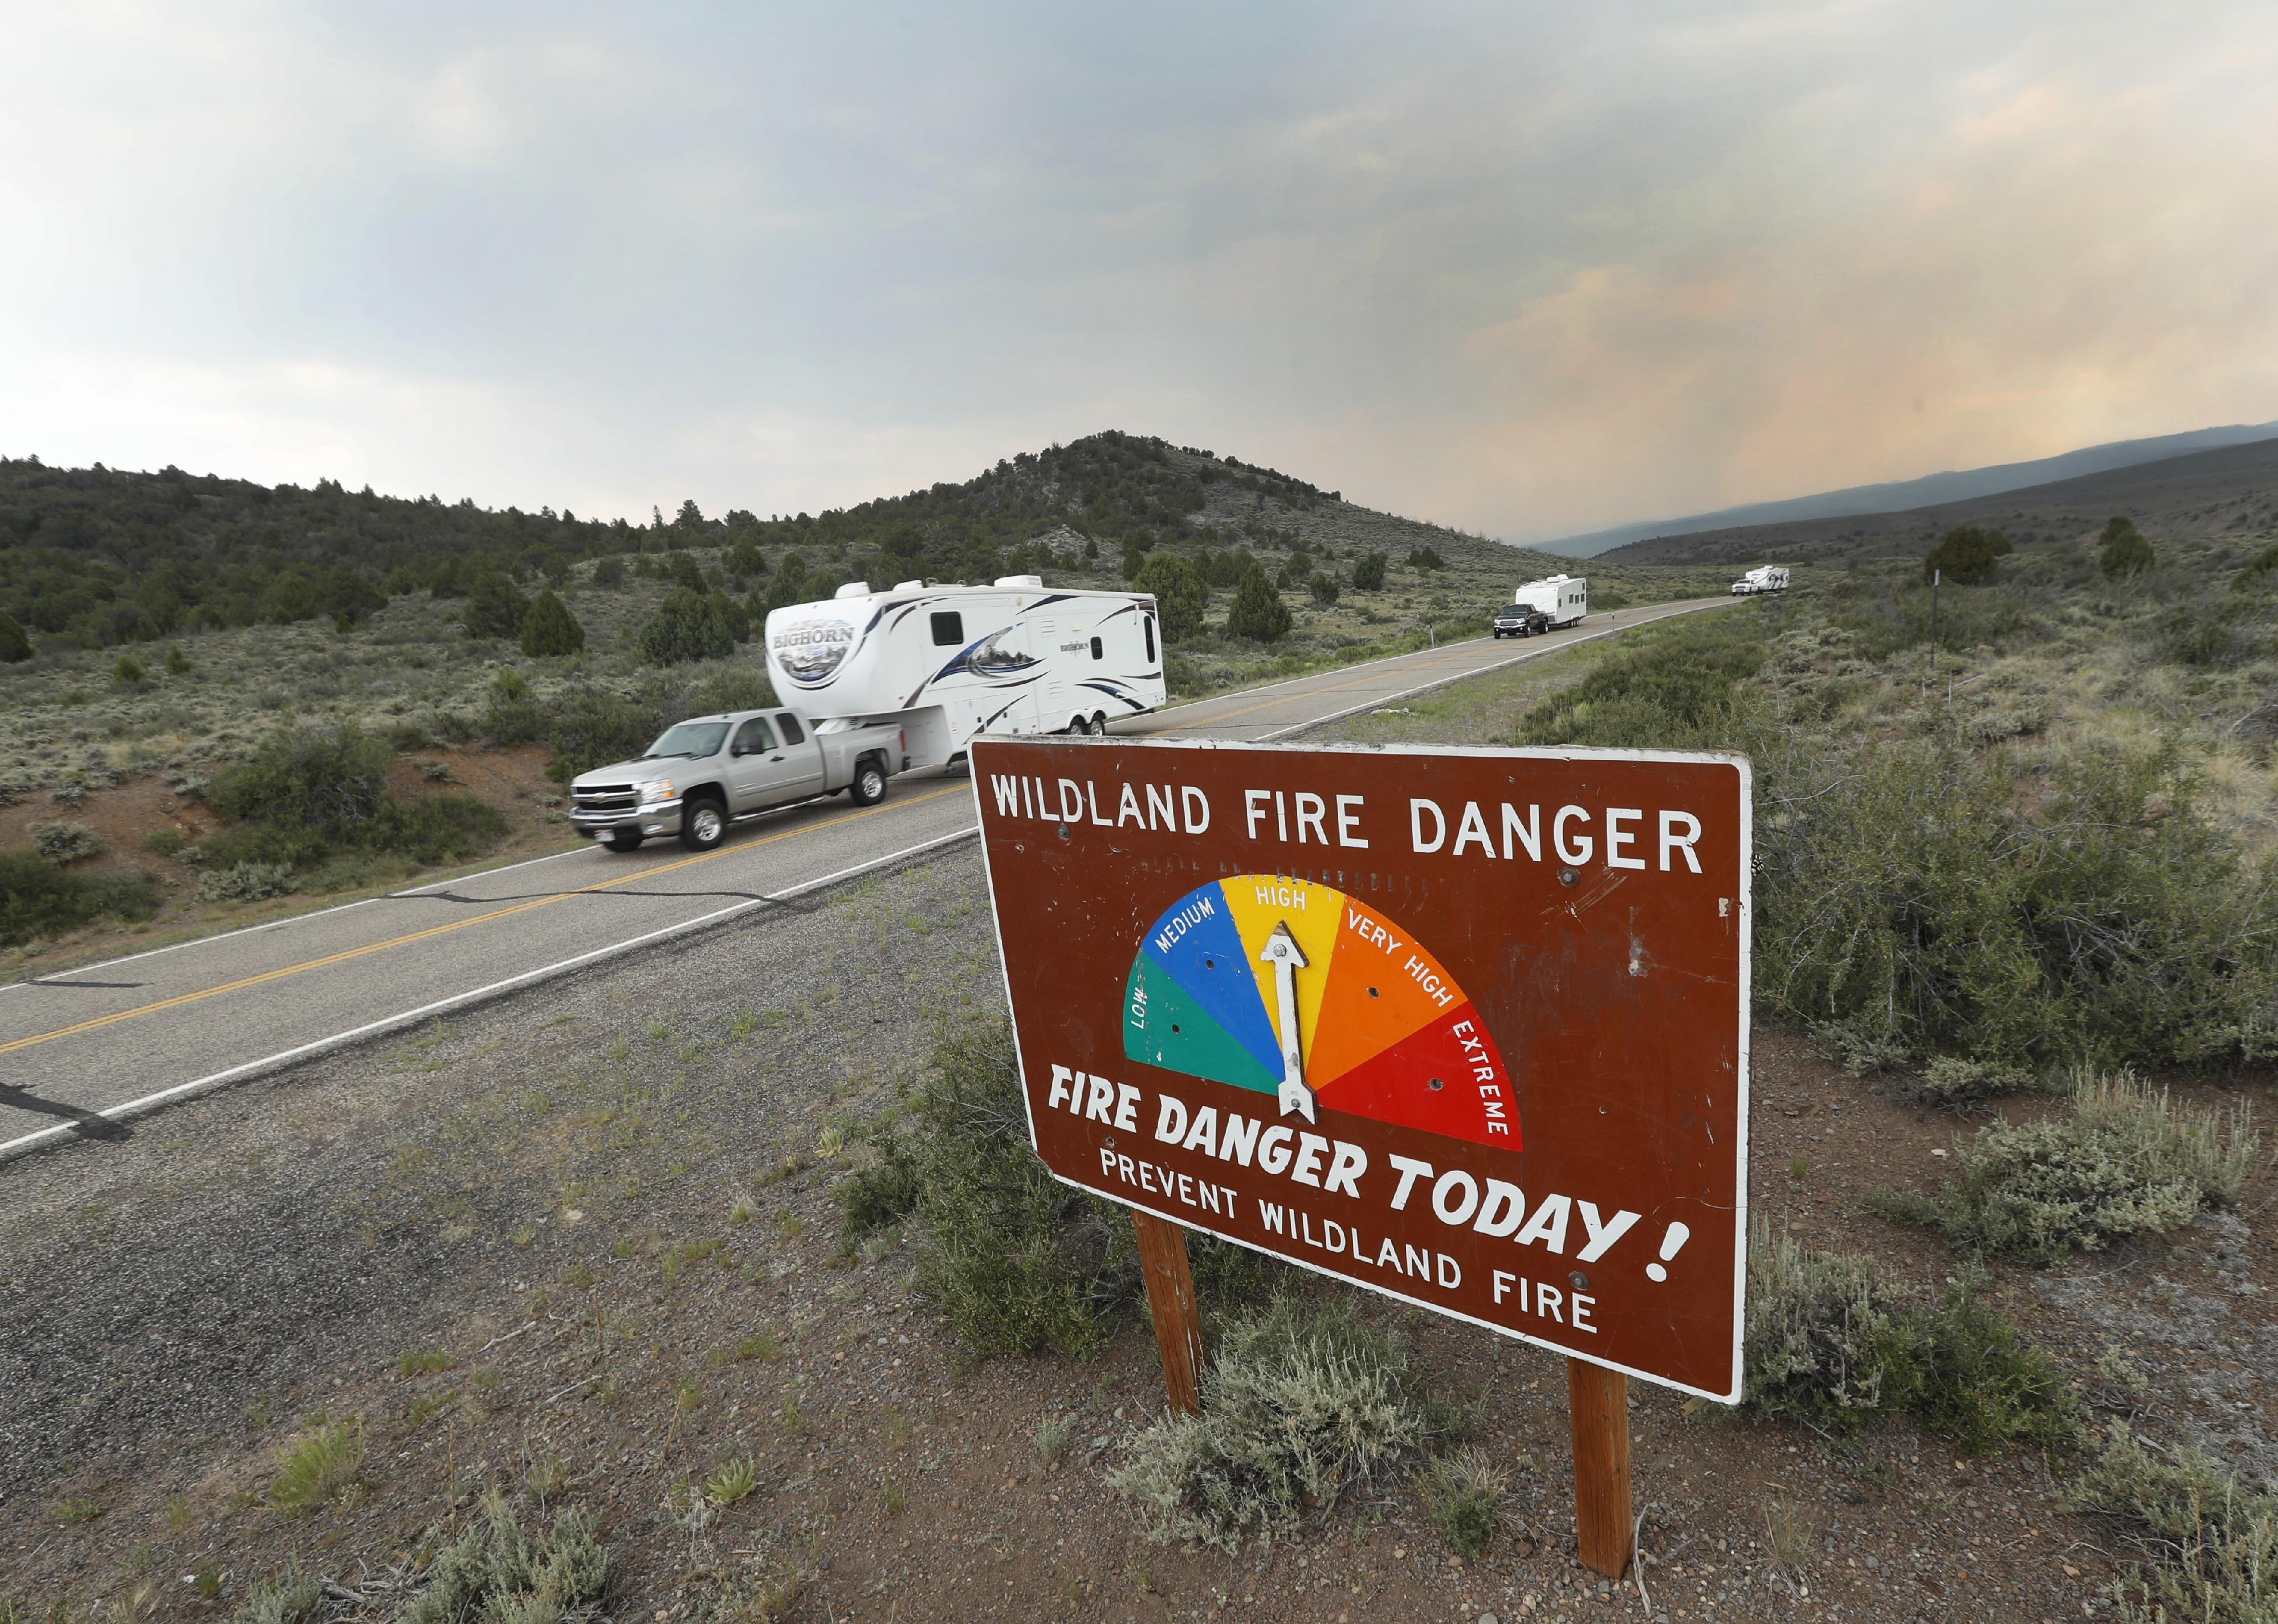
#8. Great Basin area
People move travel trailers down Highway 143 from their homes that have been evacuated due to a wildfire.
– 10-year average
— Area burned: 1.1 million acres
— Number of fires: 2,634
— Area per fire: 15.2 acres
– 2022 numbers
— Acres burned: 436,598 acres (59.7% less than 10-year average)
— Number of fires: 2,121 (19.5% less than 10-year average)
— Area per fire: 205.8 acres (1253.6% greater 10-year average)
– Worst year of the decade: 2012 (2.5 million acres)
The Great Basin area, which includes much of Idaho, Nevada, and Utah, has seen larger, more destructive wildfires in recent years, largely due to extreme drought. In recent years, southern Nevada has experienced exceptional drought conditions. In 2022, the average wildfire covered a footprint roughly 14 times larger than the average fire from the past decade. Fires in the rangelands of the Great Basin area are fueled by grasses such as cheatgrass, which is abundant and burns easily.
Lance King // Getty Images
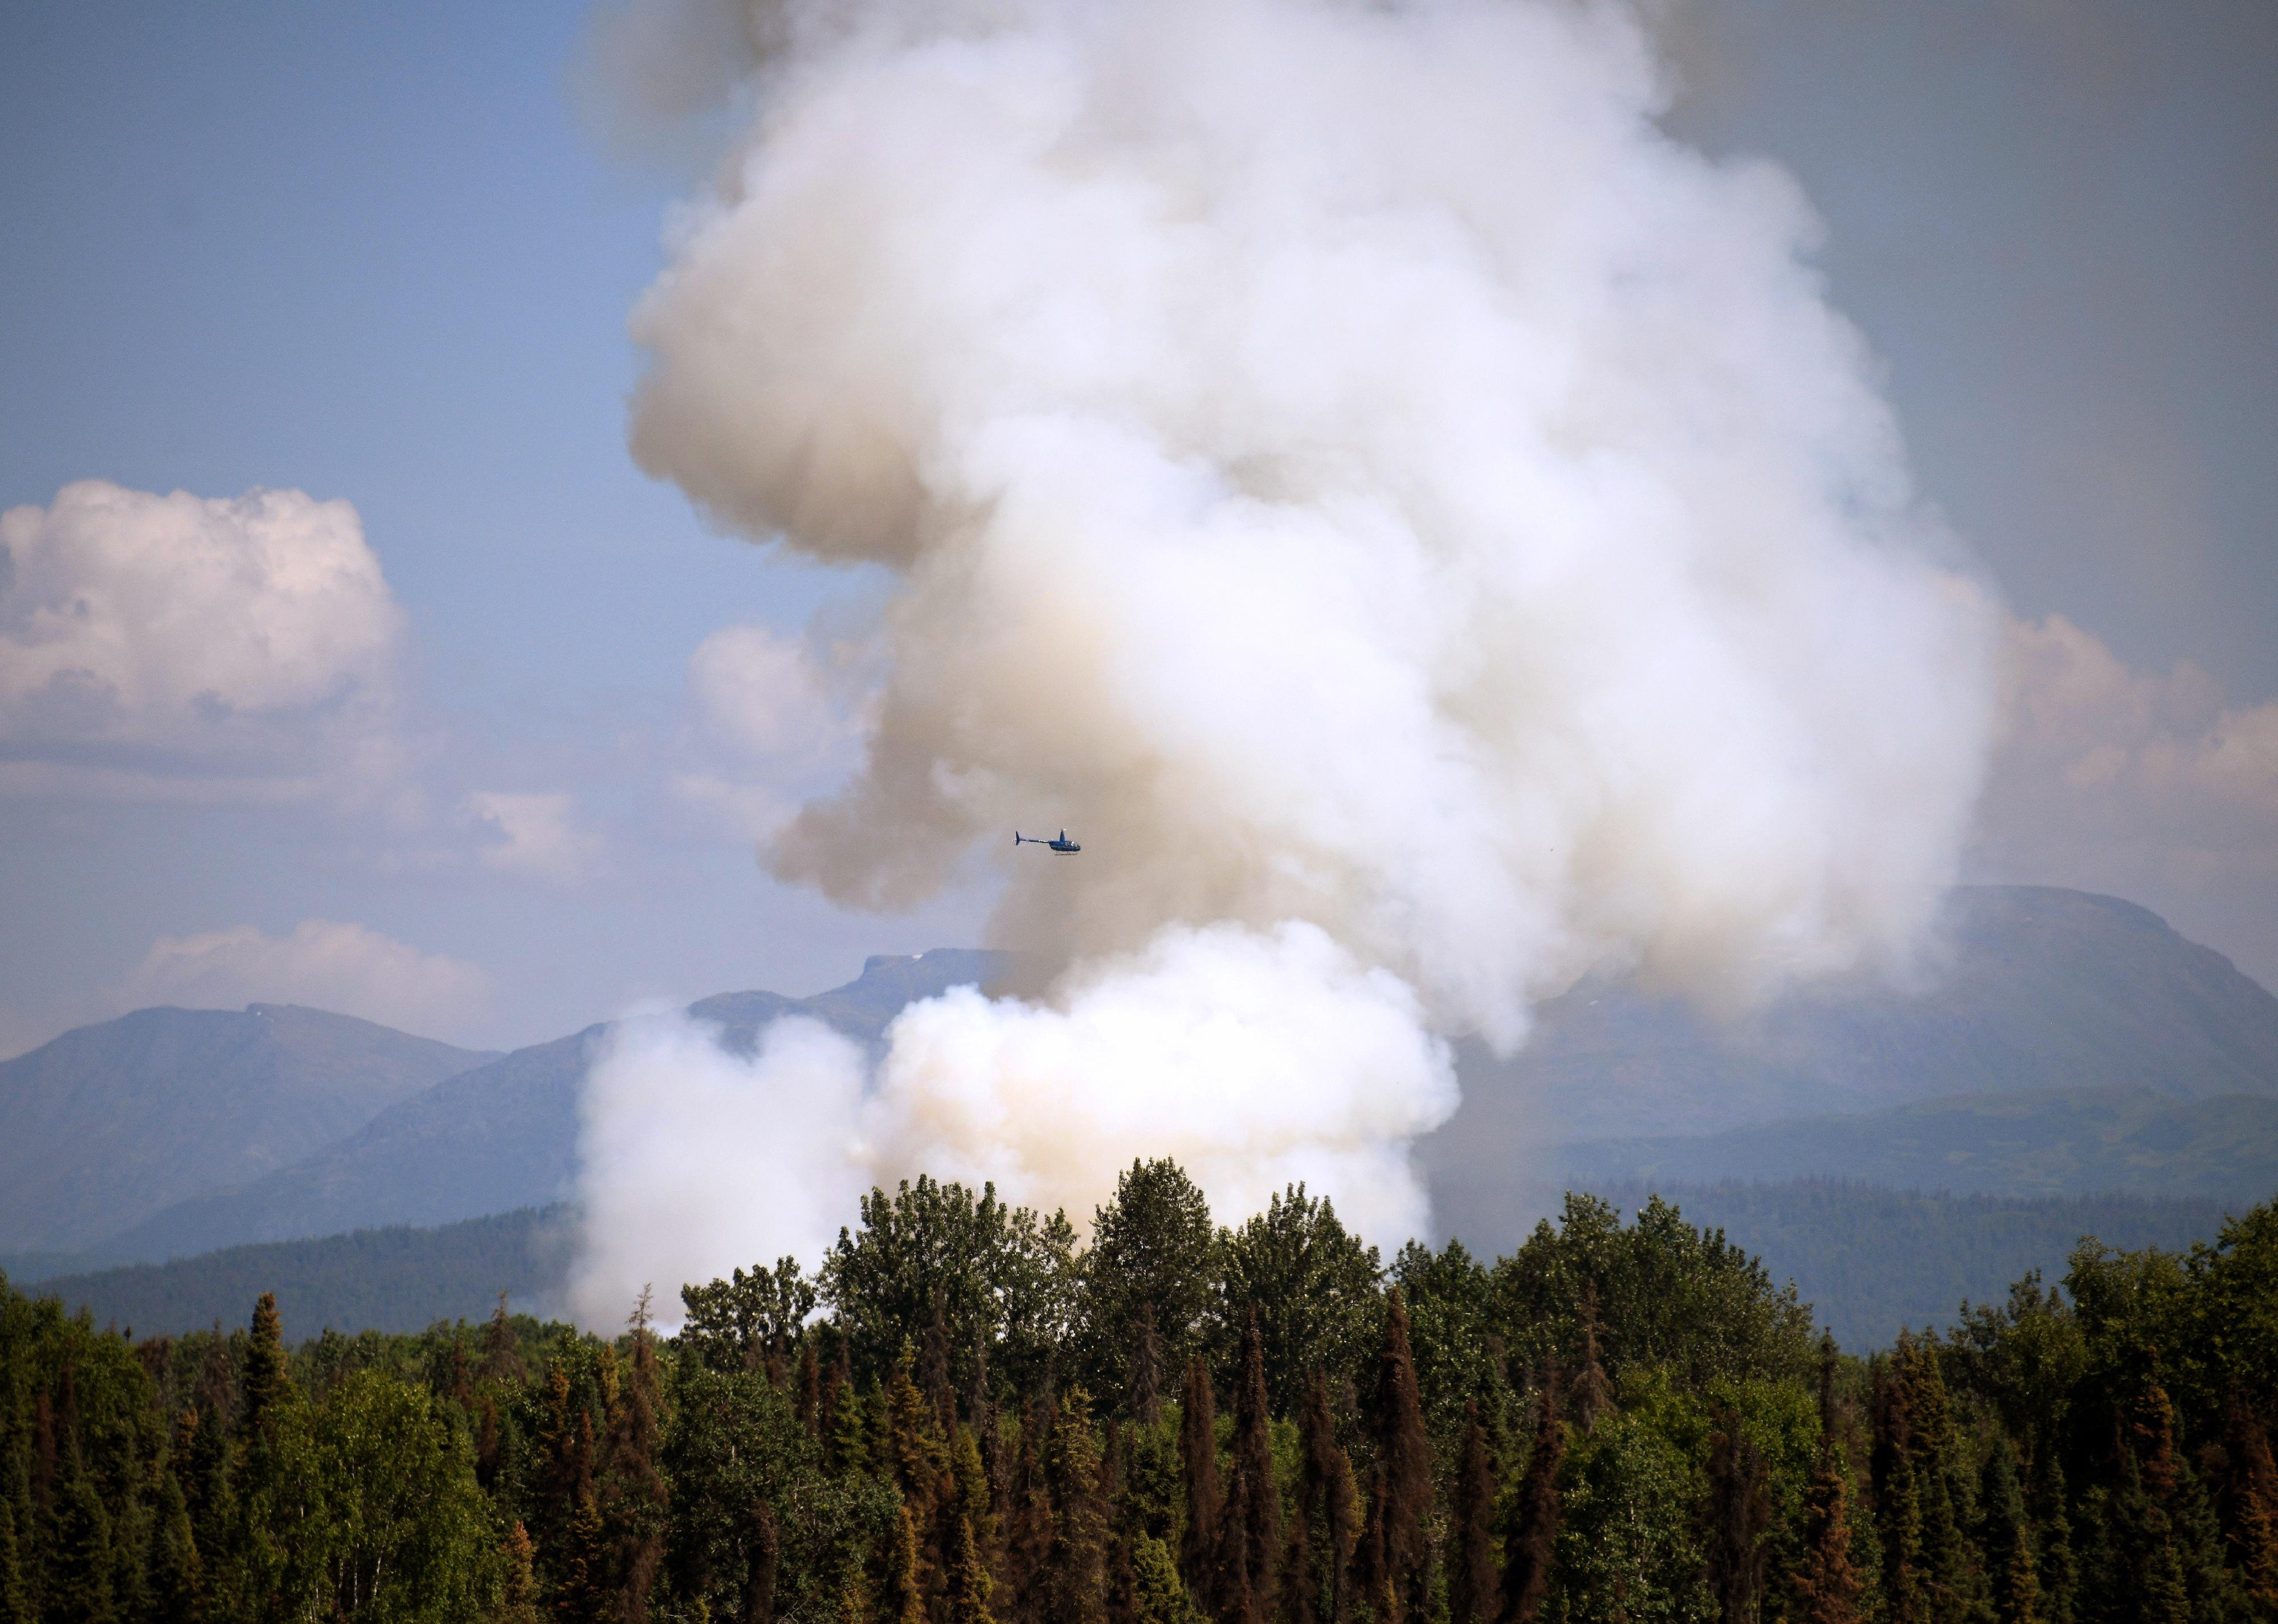
#7. Alaska area
A helicopter passes by as smoke rises from a wildfire.
– 10-year average
— Area burned: 1.1 million acres
— Number of fires: 493
— Area per fire: 119.2 acres
– 2022 numbers
— Acres burned: 3.1 million acres (171.9% greater 10-year average)
— Number of fires: 595 (20.7% greater 10-year average)
— Area per fire: 5,228.5 acres (4287.2% greater 10-year average)
– Worst year of the decade: 2015 (5.1 million acres)
In Alaska, the size and frequency of fires are exceeding historical averages. Between 2000 and 2020, wildfires burned more than double the acreage burned during the previous 20-year period. Most of this increase has occurred in the state’s tundra and boreal forest due to increased heat and drought, along with shorter snow seasons.
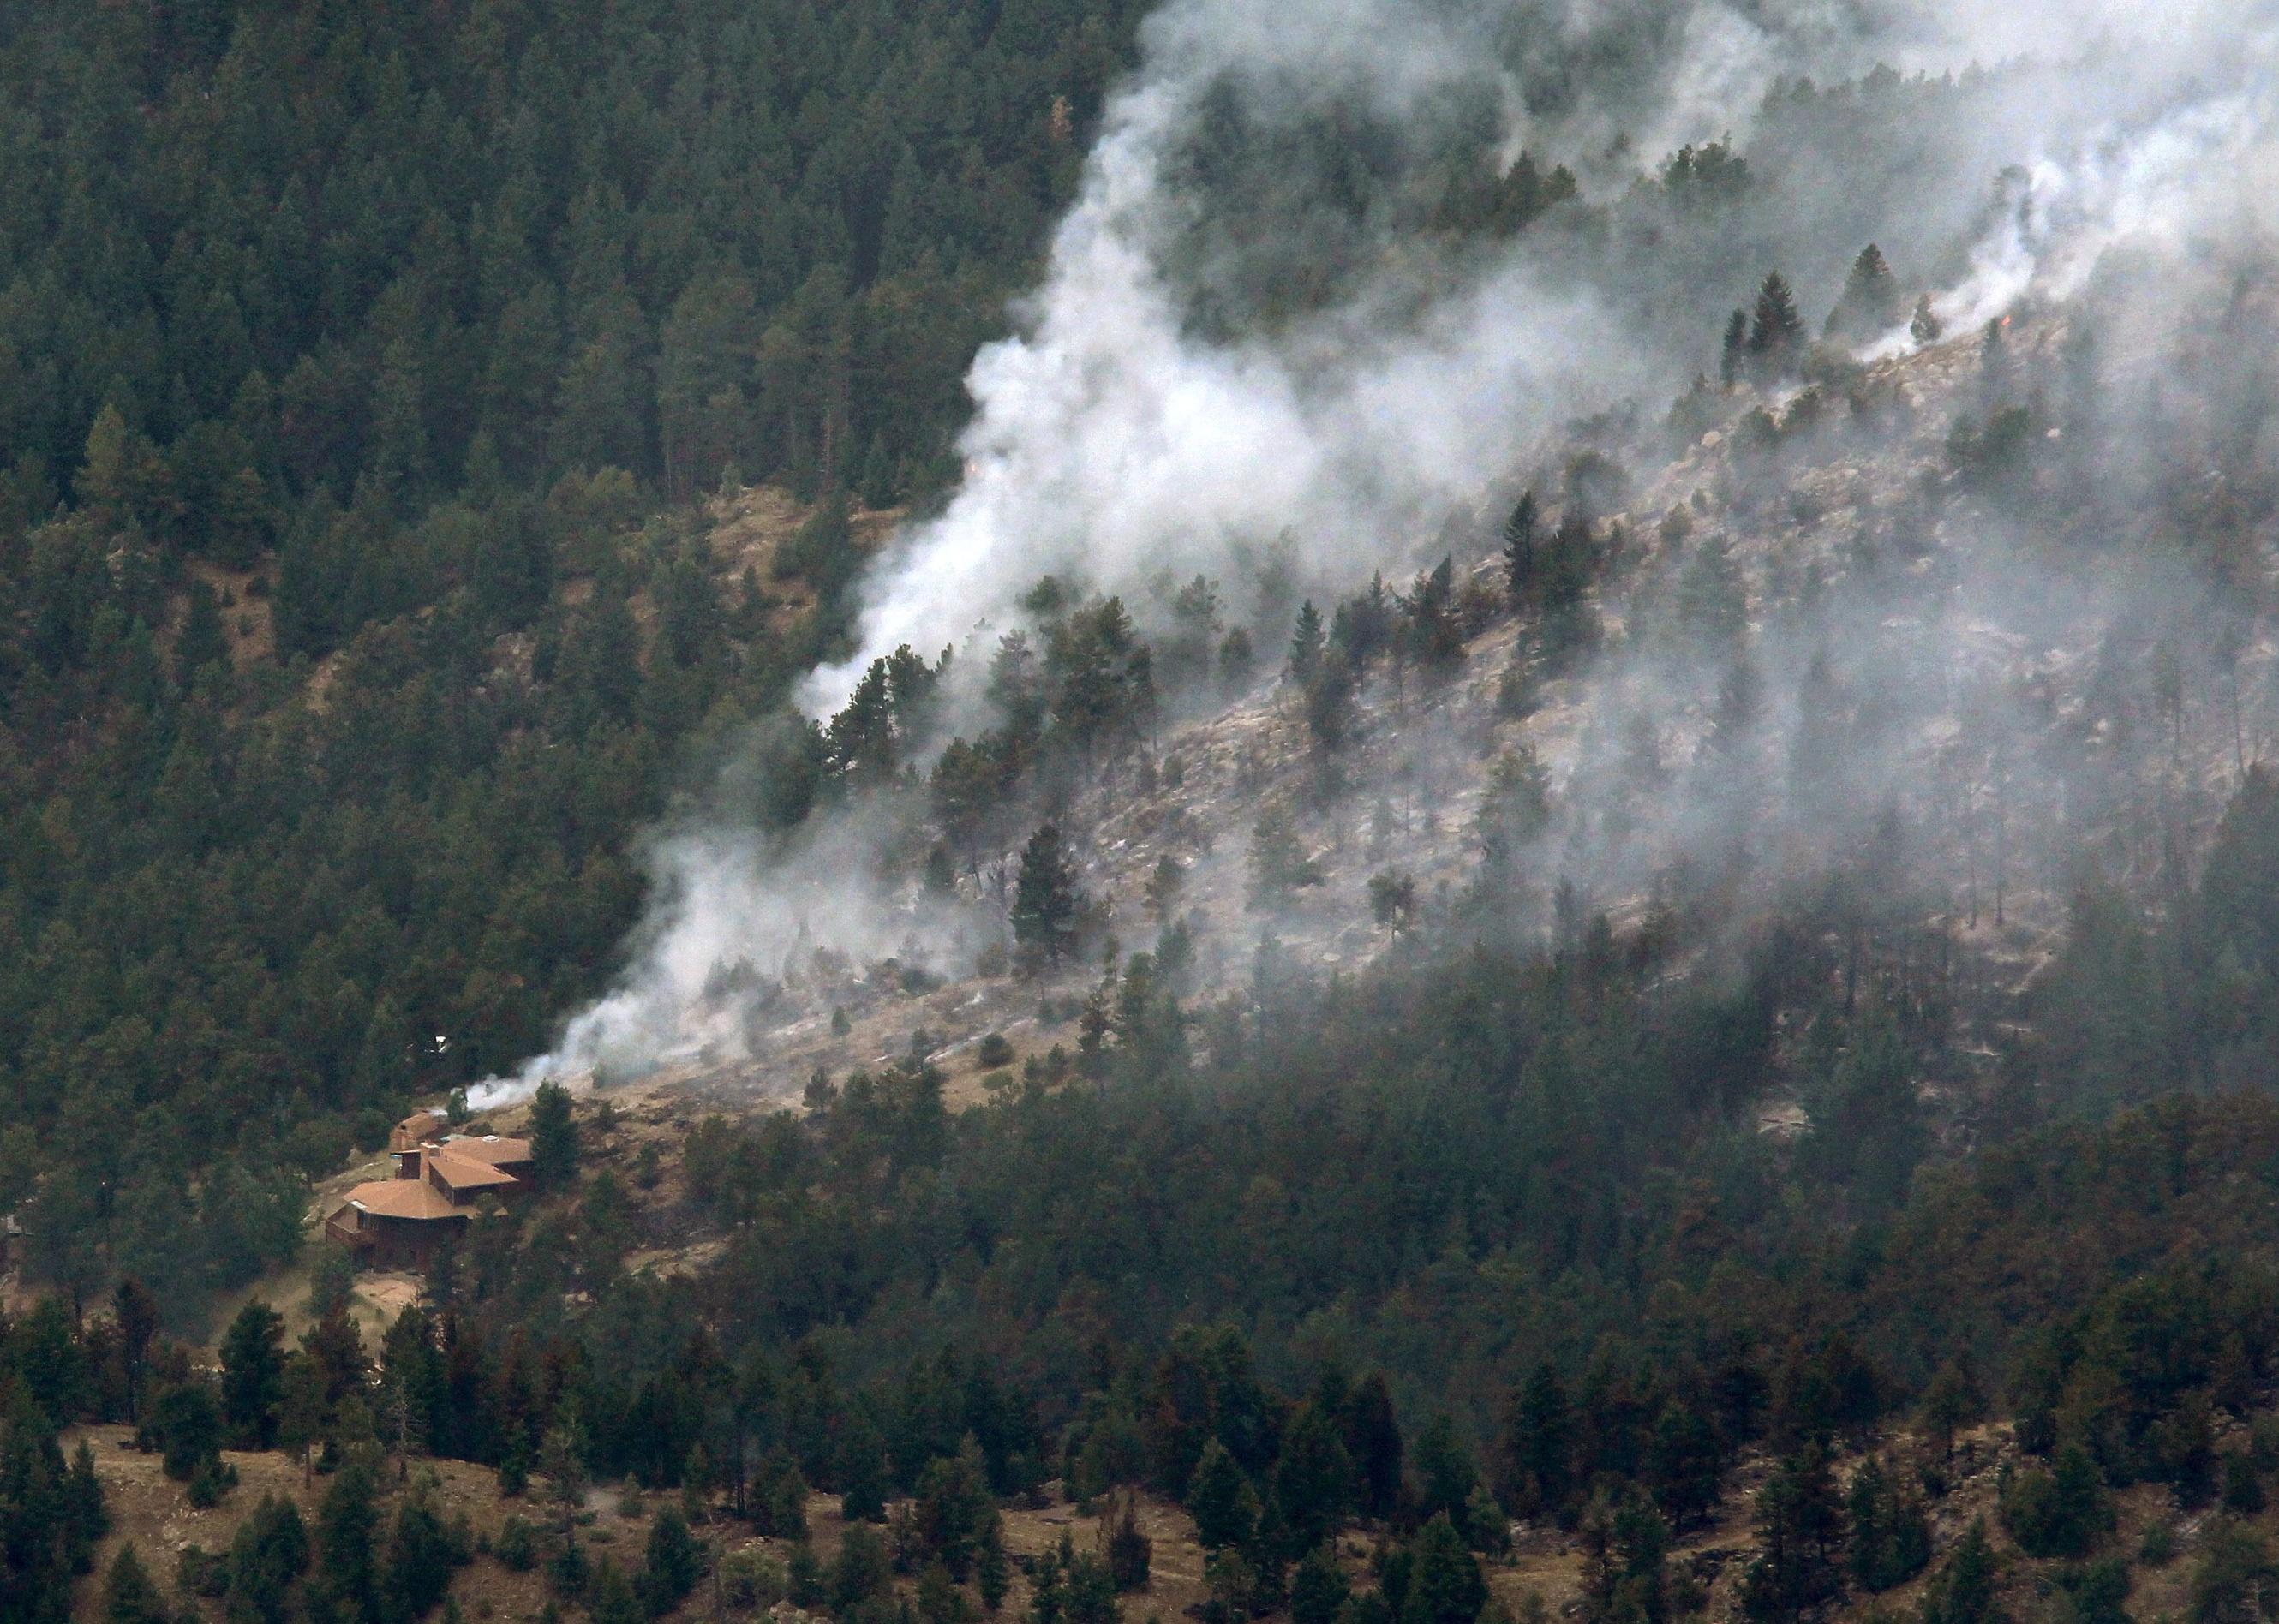
John Moore // Getty Images
#6. Rocky Mountain area
A wildfire burns through the foothills of the Rocky Mountains.
– 10-year average
— Area burned: 540,381 acres
— Number of fires: 2,991
— Area per fire: 161.2 acres
– 2022 numbers
— Acres burned: 273,503 acres (49.4% less than 10-year average)
— Number of fires: 2,392 (20.0% less than 10-year average)
— Area per fire: 114.3 acres (29.1% less than 10-year average)
– Worst year of the decade: 2012 (1.2 million acres)
Forests at high elevations in the Rocky Mountains are burning more now than at any time in the past 2,000 years as a result of extreme heat and drought, according to a 2021 study published by the Proceedings of the National Academy of Sciences. In 2020 alone, the area burned in the central Rocky Mountains nearly doubled the cumulative area burned in that region since 1984, the study found. This trend is especially alarming because, historically, subalpine forests burn infrequently.
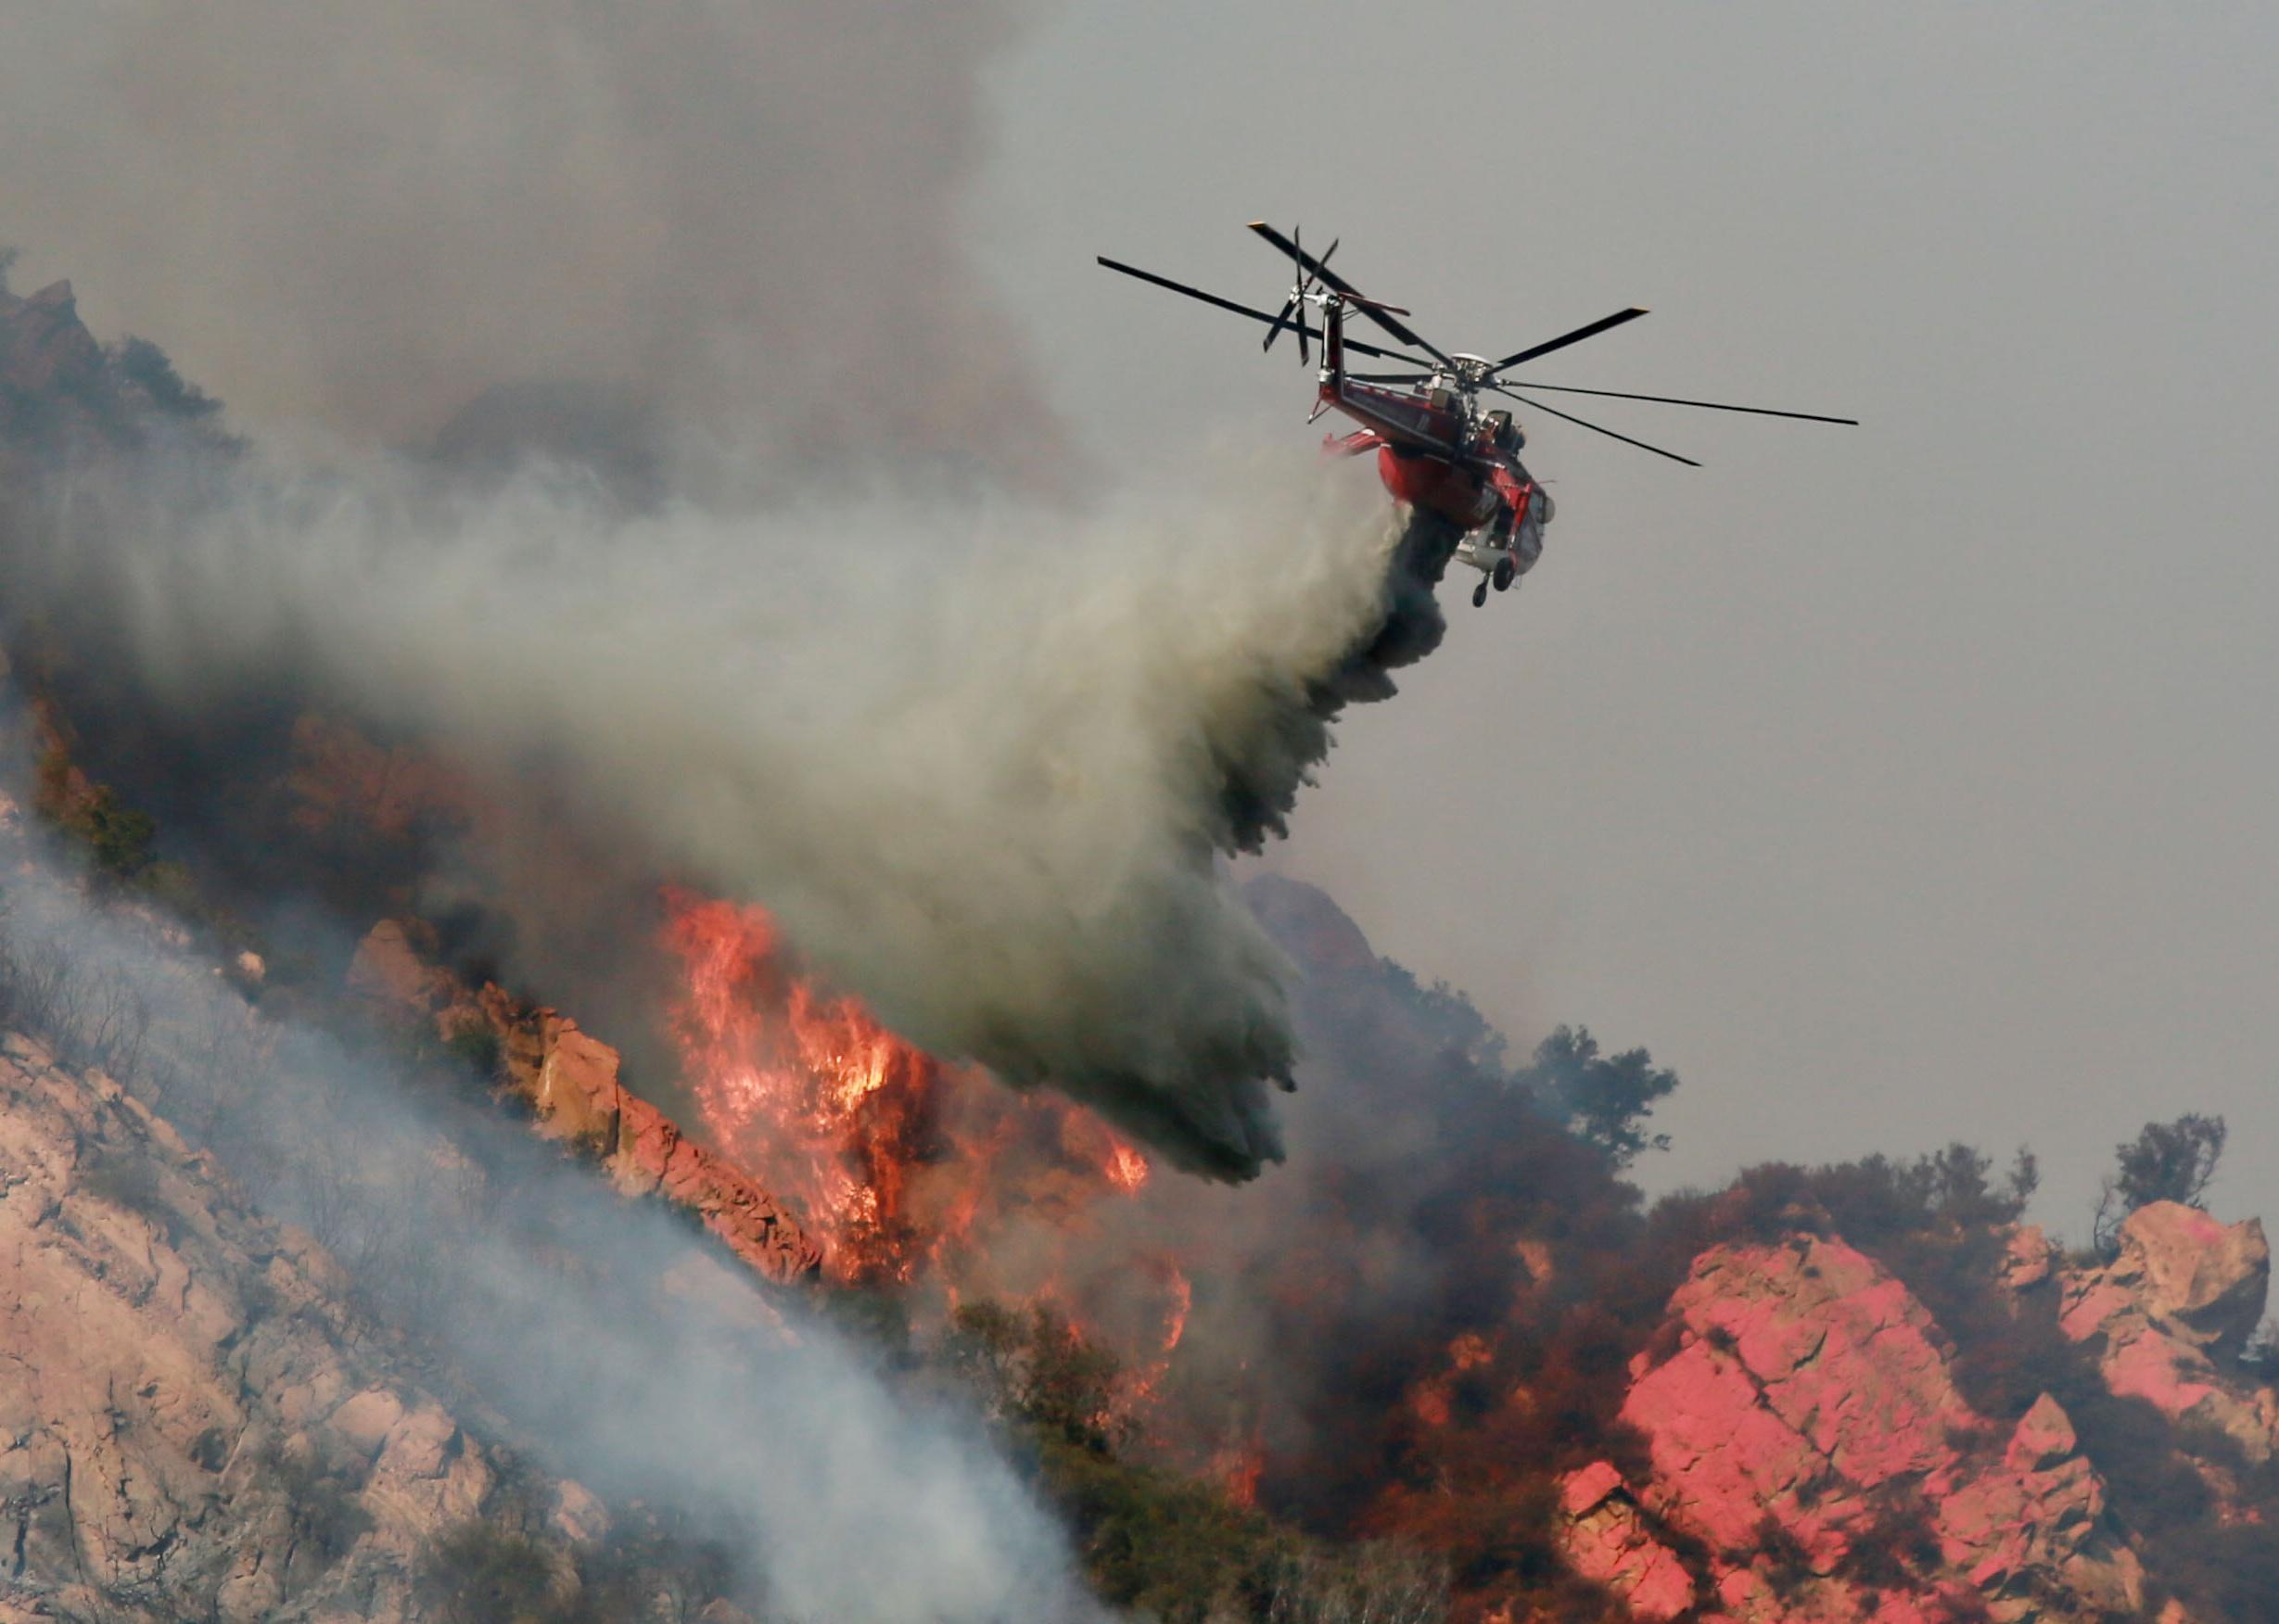
Sandy Huffaker // Getty Images
#5. Southern California area
A helicopter drops flame retardant on a wildfire in Malibu, California.
– 10-year average
— Area burned: 384,102 acres
— Number of fires: 4,619
— Area per fire: 210.5 acres
– 2022 numbers
— Acres burned: 87,350 acres (77.3% less than 10-year average)
— Number of fires: 4,460 (3.4% less than 10-year average)
— Area per fire: 19.6 acres (90.7% less than 10-year average)
– Worst year of the decade: 2020 (1.1 million acres)
The Southern California area includes everything south of Sacramento. Extreme heat and drought have impacted this region more than most others in the U.S. An abundance of dead, dry, accumulated vegetation—including pine needles and leaf litter—is wildfire fuel just waiting for combustion. In 2021 alone, roughly 1.5 million acres of the Sierra Nevada region—which span into Southern California—burned. The majority of those acres were subject to high-severity fire, which killed at least three-quarters of the vegetation.
DanVanPelt // Shutterstock
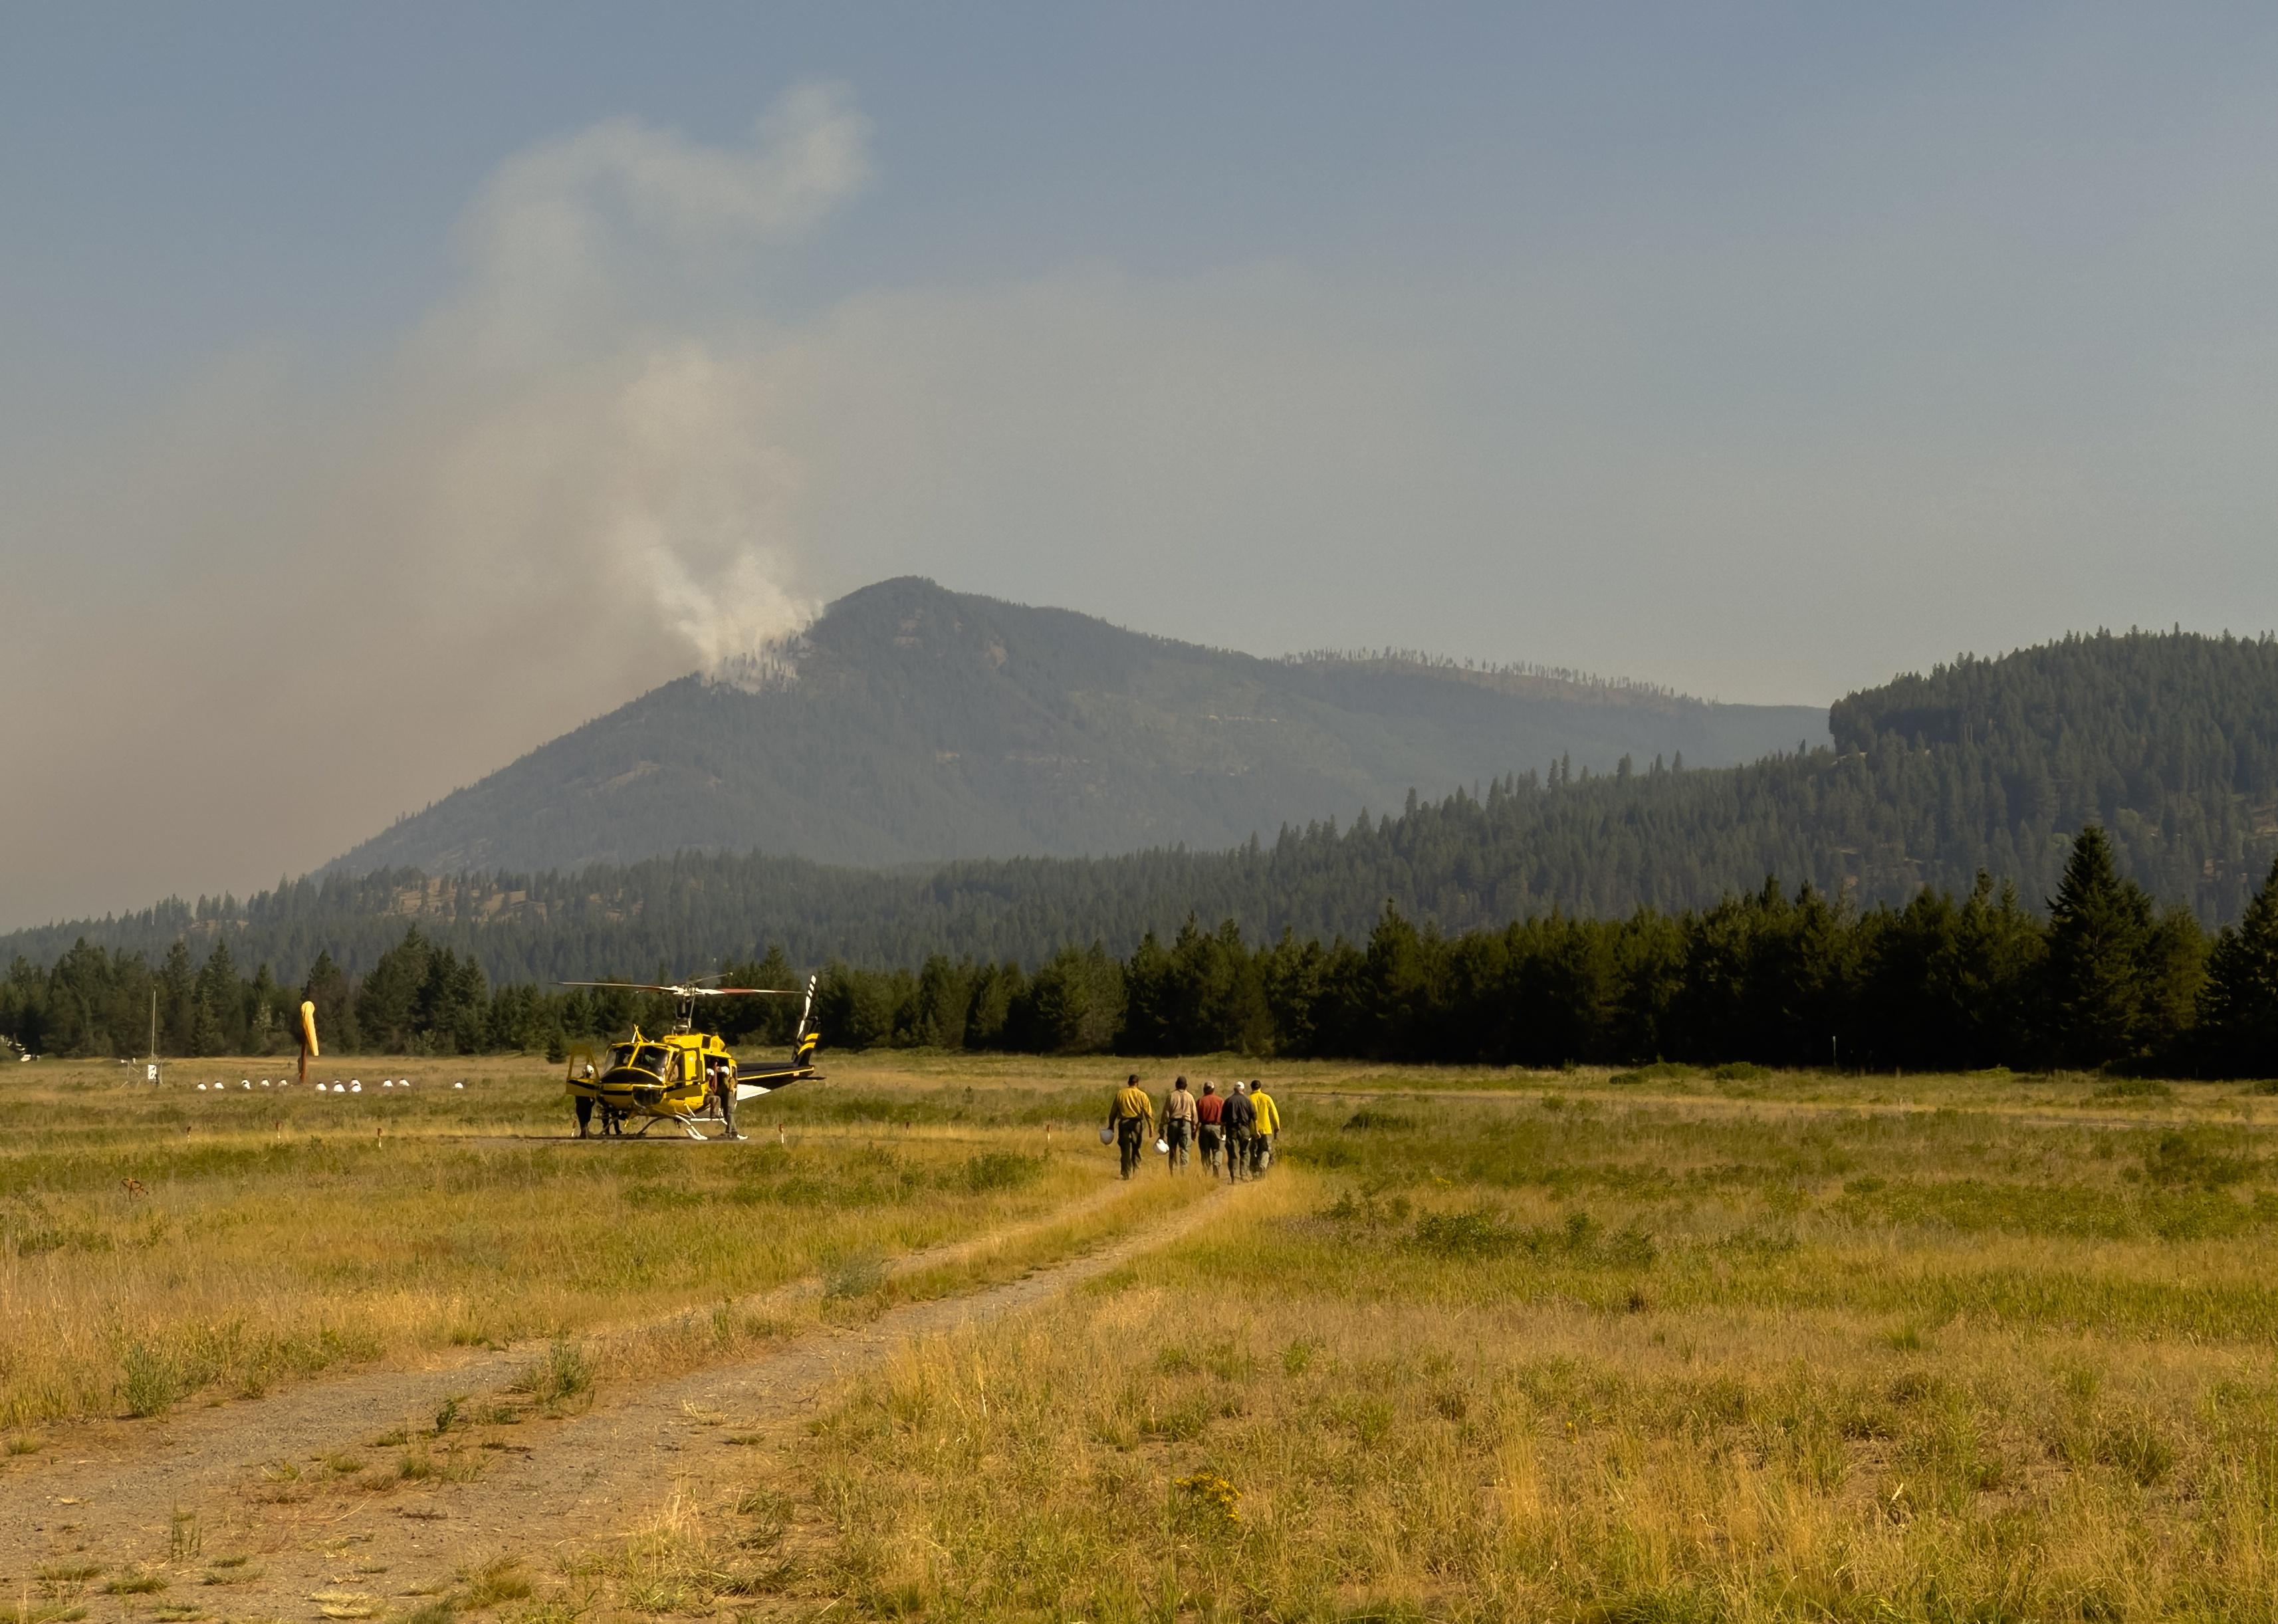
#4. Northern Rockies area
Group of firefighters approach helicopter at Kootenai Forest fire.
– 10-year average
— Area burned: 601,391 acres
— Number of fires: 3,179
— Area per fire: 316.9 acres
– 2022 numbers
— Acres burned: 223,746 acres (62.8% less than 10-year average)
— Number of fires: 2,710 (14.8% less than 10-year average)
— Area per fire: 82.6 acres (73.9% less than 10-year average)
– Worst year of the decade: 2017 (1.6 million acres)
Montana, North Dakota, northern Idaho, and portions of South Dakota and Wyoming comprise the Northern Rockies region. Here, excessive dryness can lead to increased risks of wildfires. Recent assessments of the region describe how drought, even in the midst of extreme cold, can freeze-dry vegetation, which then fuels wildfires in the absence of low moisture levels.
PAYTON BRUNI // Getty Images
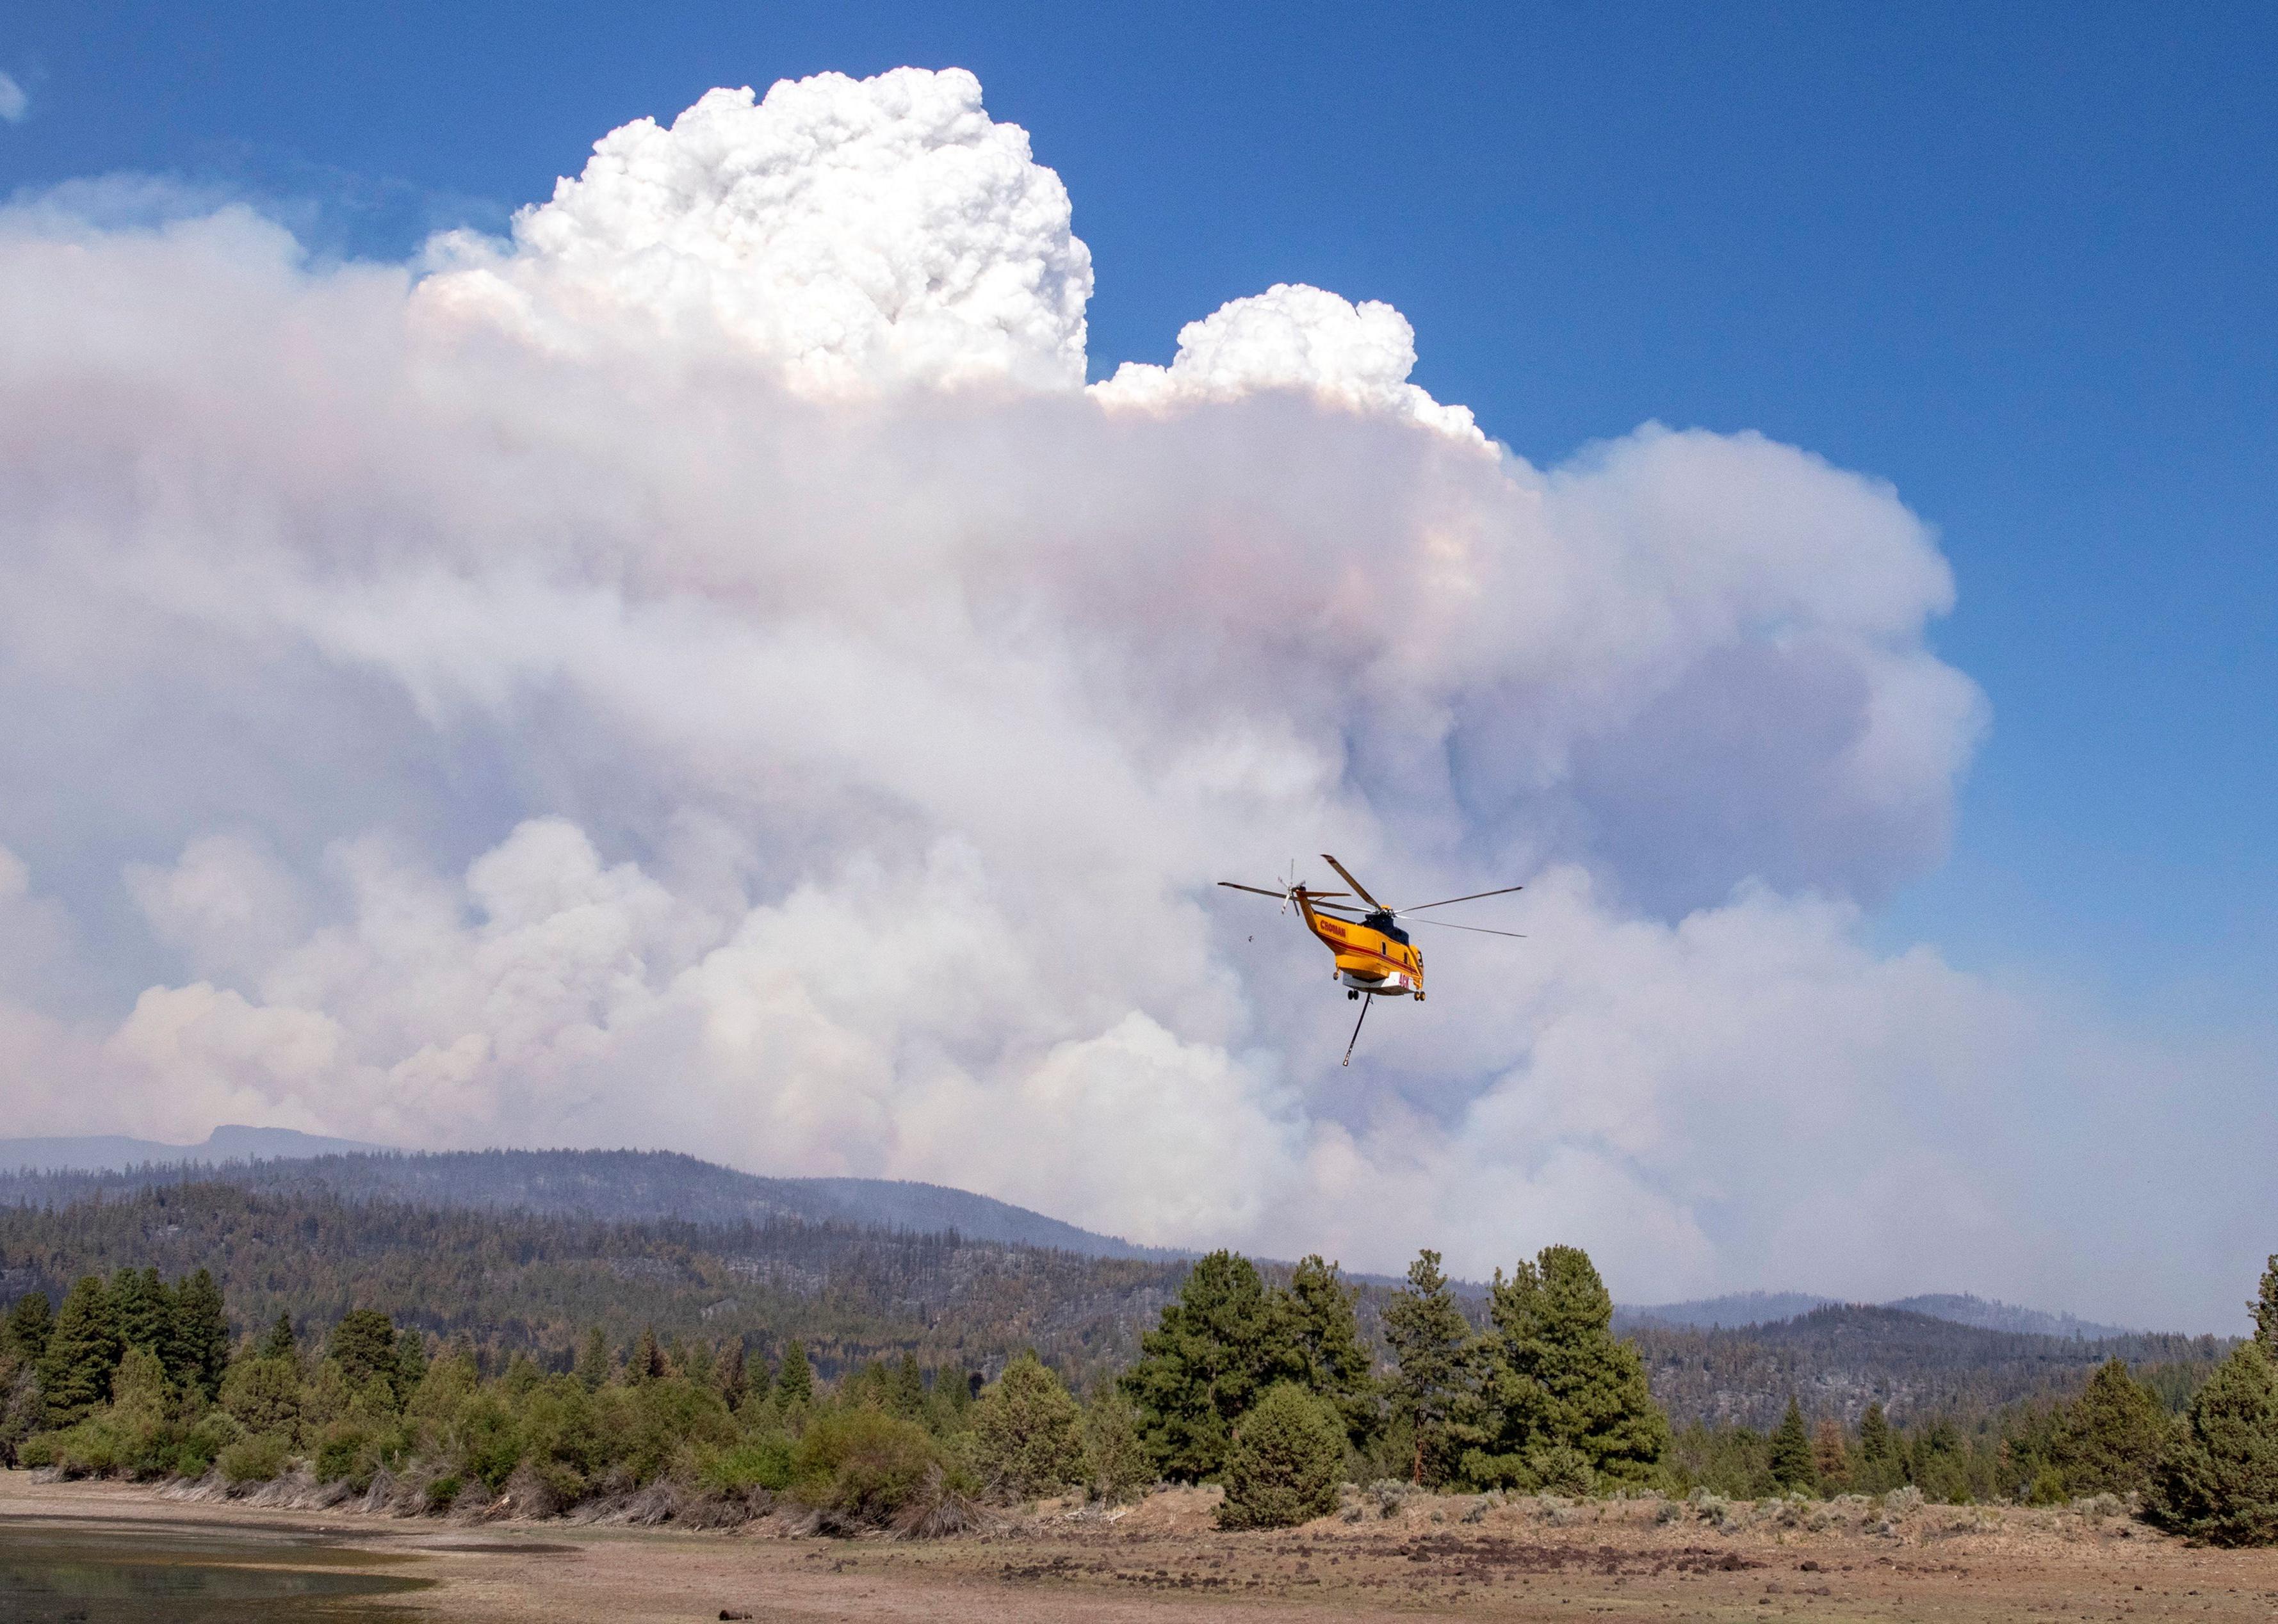
#3. Northwest area
A helicopter flies with a load of water for a fire.
– 10-year average
— Area burned: 1.2 million acres
— Number of fires: 3,717
— Area per fire: 342.5 acres
– 2022 numbers
— Acres burned: 631,605 acres (47.1% less than 10-year average)
— Number of fires: 3,611 (2.9% less than 10-year average)
— Area per fire: 174.9 acres (48.9% less than 10-year average)
– Worst year of the decade: 2020 (2.0 million acres)
Encompassing Washington and Oregon, the Northwest area is characterized by forests, shrublands, and grasslands. Climate change has led to extreme heat and drought conditions in the region; this includes less snowpack, earlier snowpack melt, dry soil, and dry vegetation. These factors—especially in tandem—have intensified wildfires, making it easier for them to start and spread.
Oscar Sosa // Getty Images
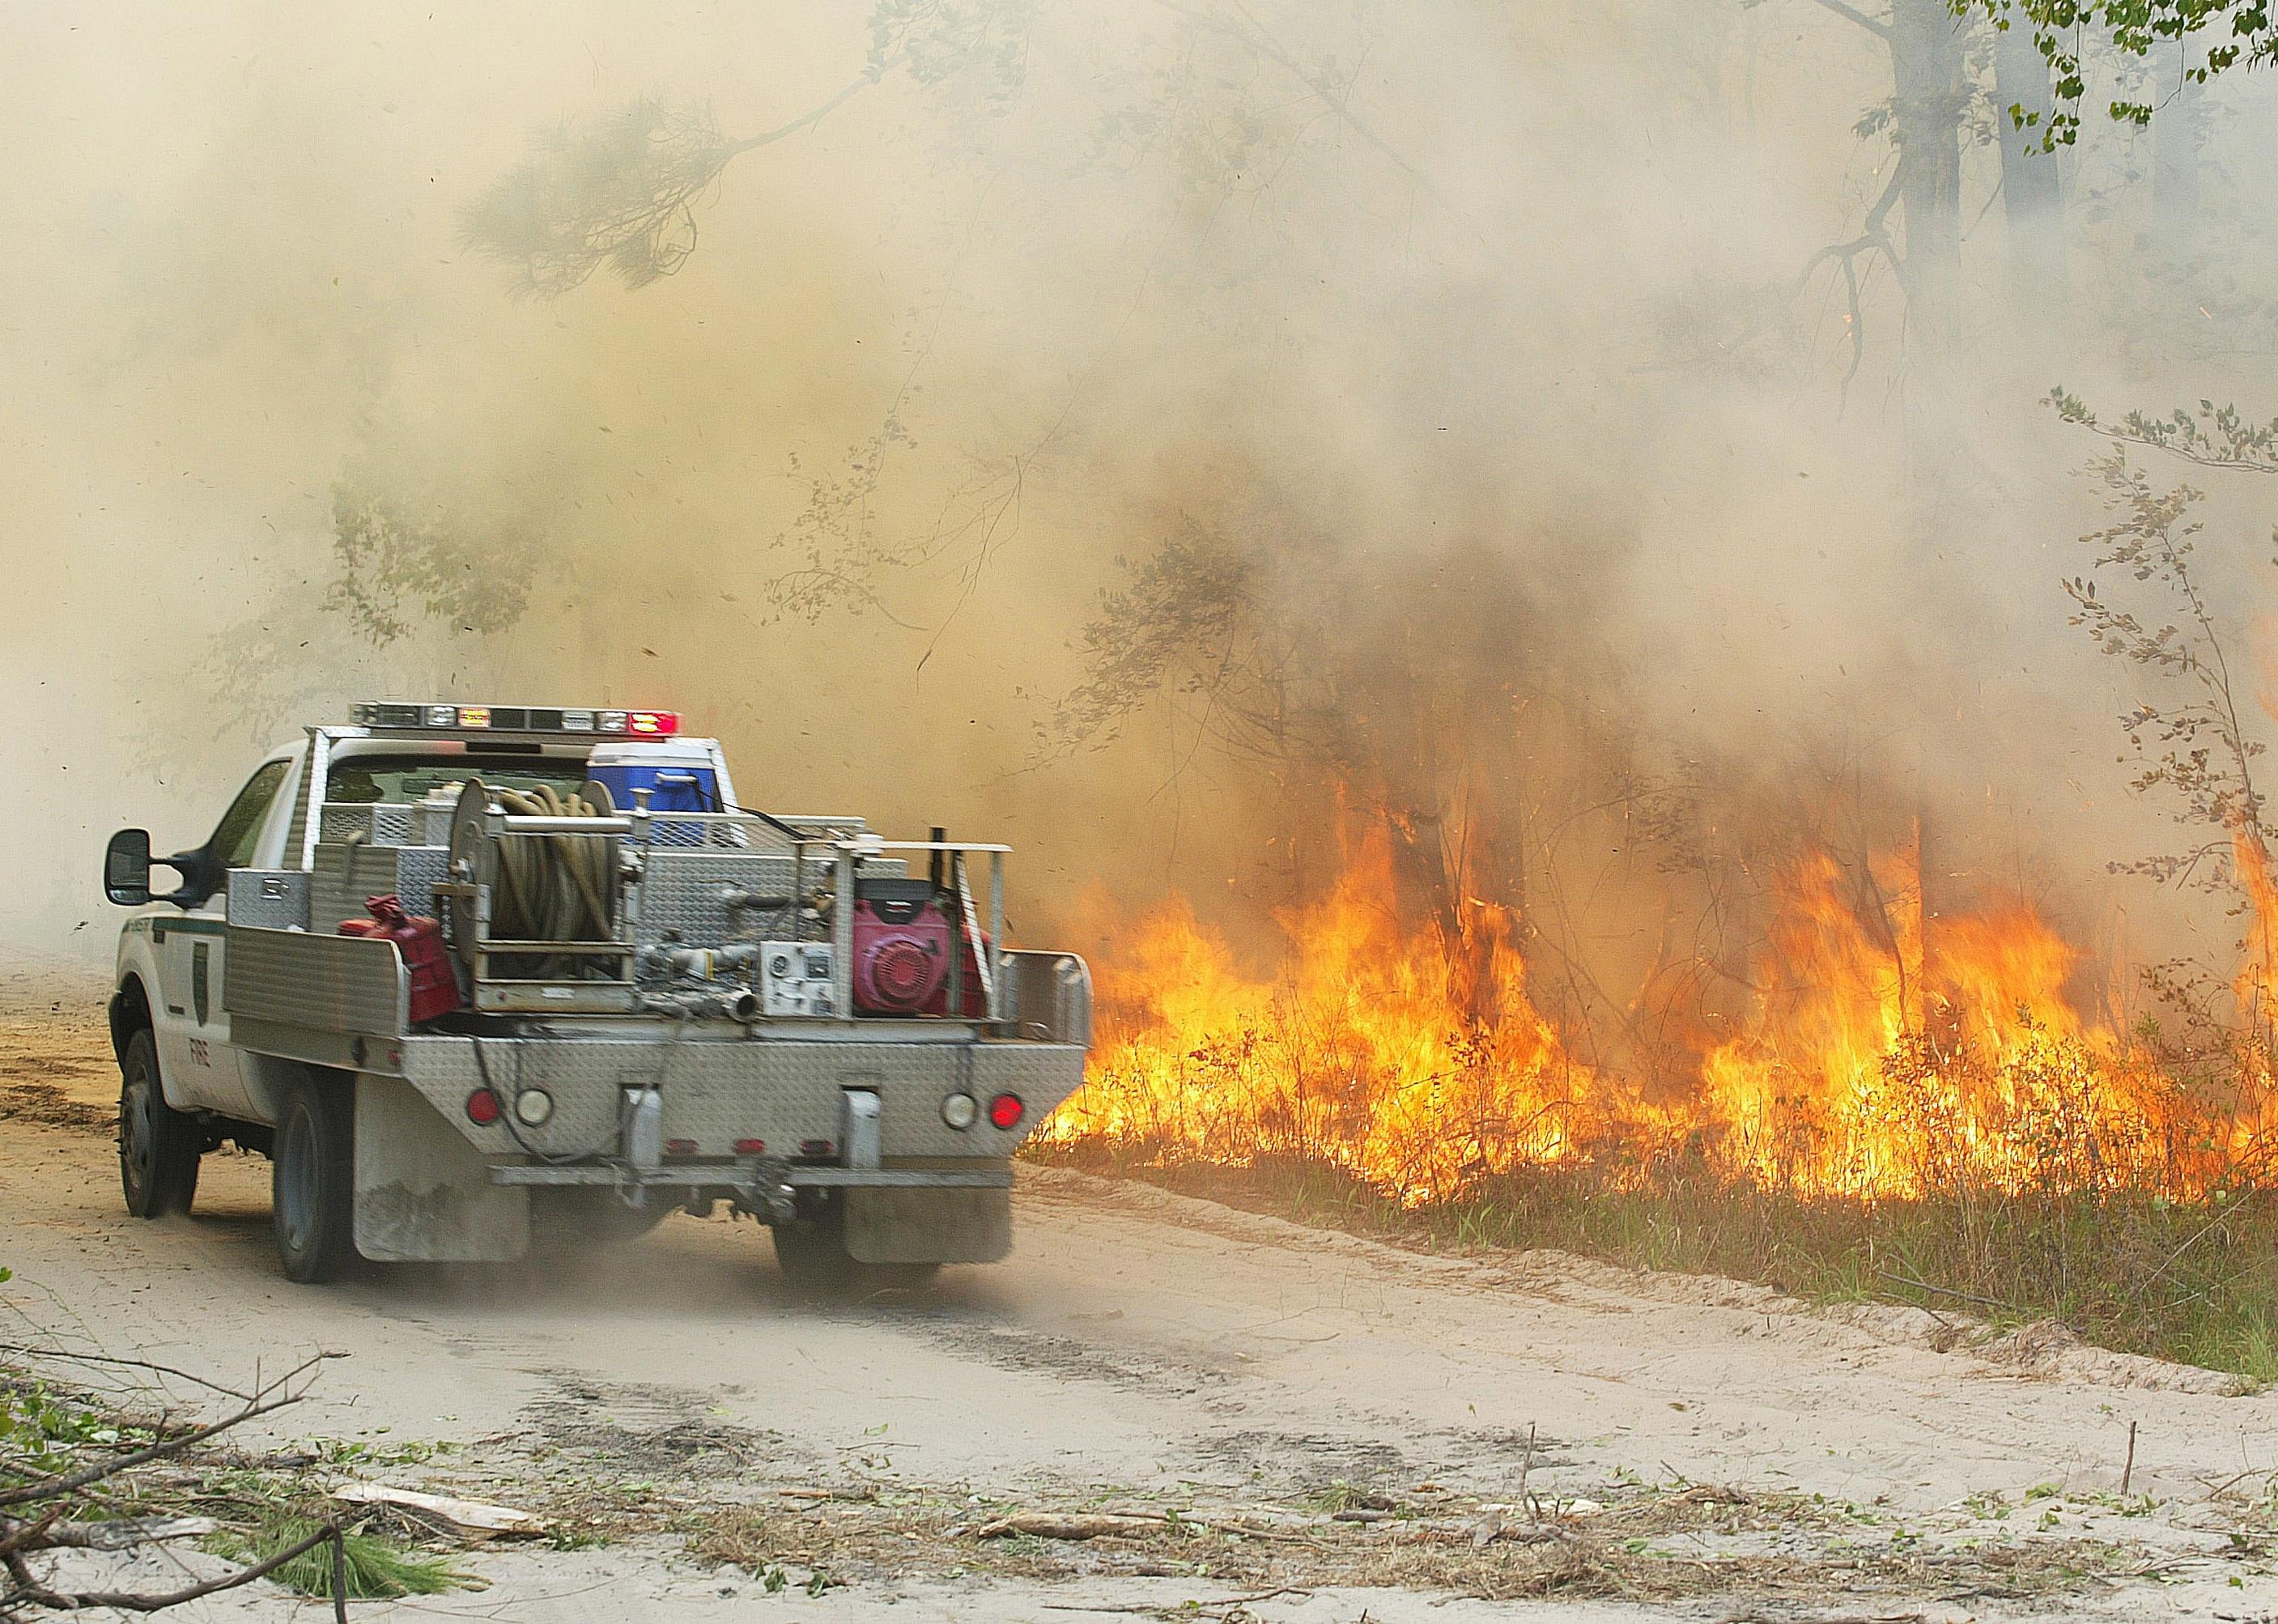
#2. Southern area
A forest service vehicle drives past a fire burning in a wooded area.
– 10-year average
— Area burned: 894,181 acres
— Number of fires: 27,247
— Area per fire: 368.0 acres
– 2022 numbers
— Acres burned: 1.5 million acres (69.8% greater 10-year average)
— Number of fires: 38,945 (42.9% greater 10-year average)
— Area per fire: 39.0 acres (89.4% less than 10-year average)
– Worst year of the decade: 2017 (2.0 million acres)
The Southern area covers 13 states, from Virginia down to Florida on the East Coast and stretching as far west as Oklahoma and Texas. Modeling suggests the Southeastern U.S. will experience an increase in fire risk as well as a longer fire season over the next several decades. Climate change will also likely bring more lightning. Areas burned by lightning-ignited wildfires are expected to increase by 30% by 2060.
Thompson D // Shutterstock
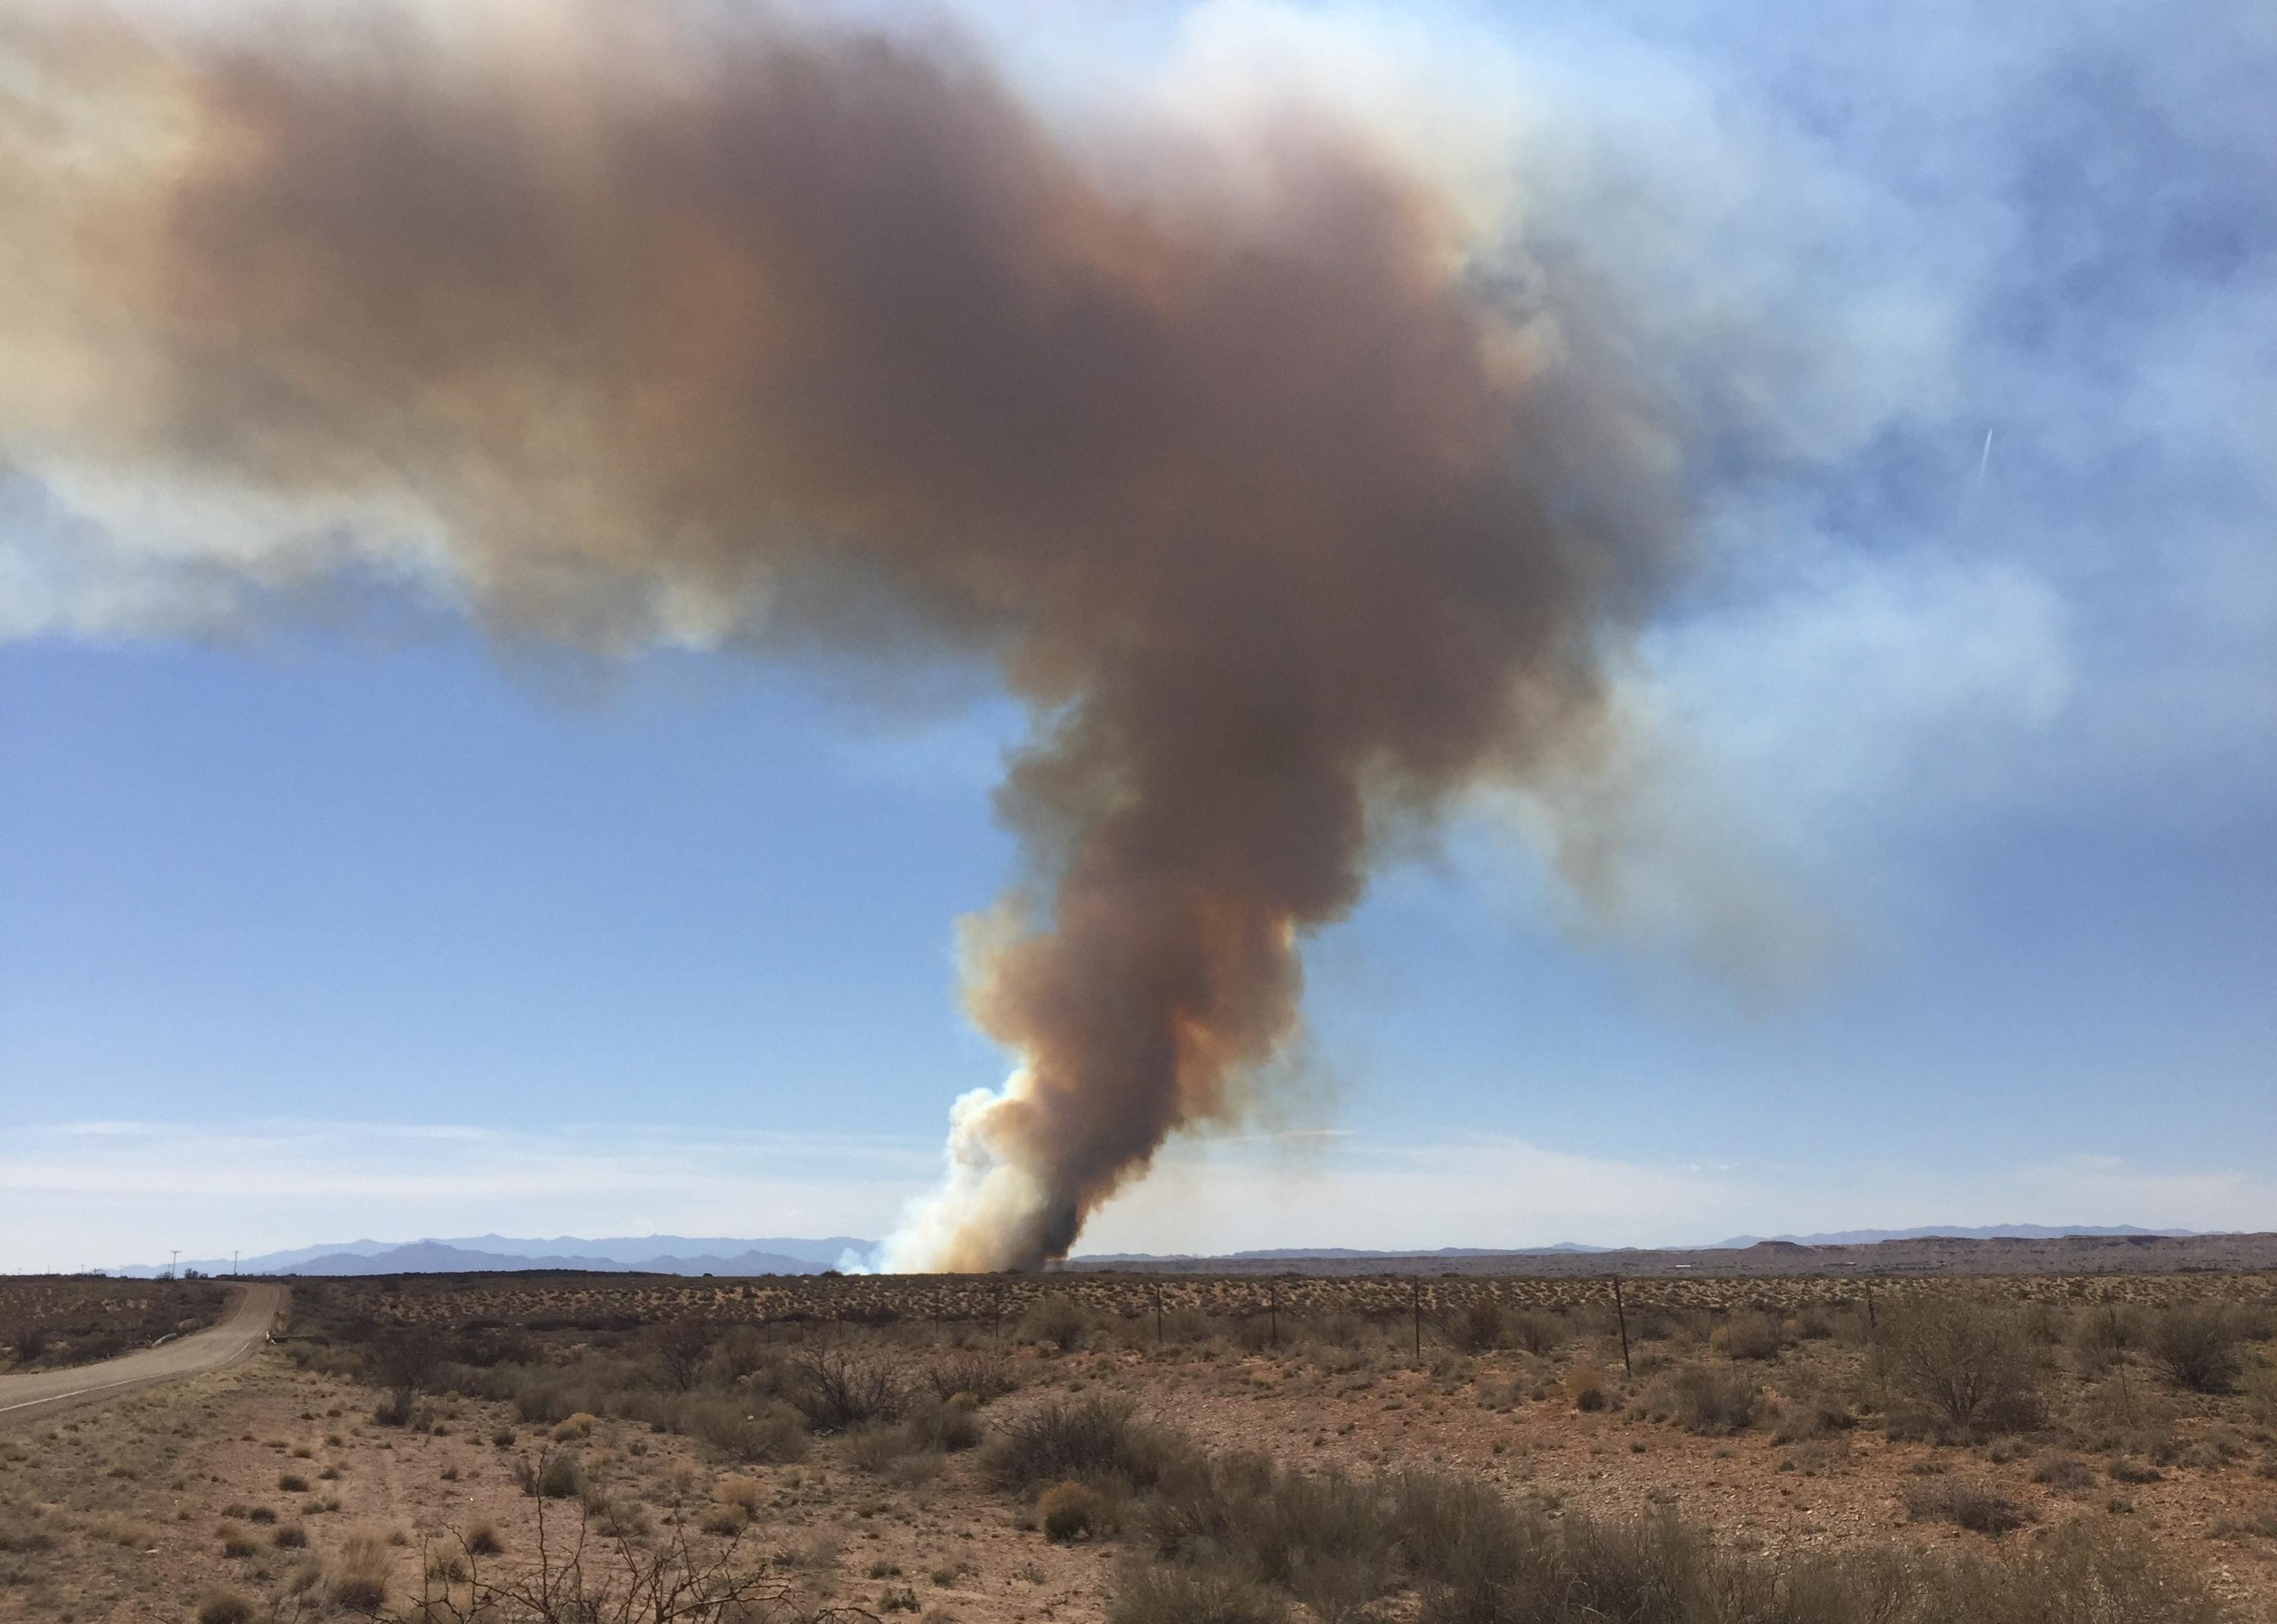
#1. Southwest area
Bosque fire in the distance during the New Mexico summertime.
– 10-year average
— Area burned: 514,715 acres
— Number of fires: 2,838
— Area per fire: 2,163.2 acres
– 2022 numbers
— Acres burned: 983,957 acres (91.2% greater 10-year average)
— Number of fires: 2,133 (24.8% less than 10-year average)
— Area per fire: 461.3 acres (78.7% less than 10-year average)
– Worst year of the decade: 2020 (1.0 million acres)
The Southwest area is one of the smallest geographical regions, covering just Arizona and New Mexico. However, it’s experiencing some of the most dramatic wildfire changes fueled largely by heat and drought. Fire season in these two states is now starting earlier in the year and is also characterized by a growing number of fires per season. Wildfire season starting earlier in the spring means it is coinciding with periods of typical, seasonal heavy winds, which allow fires to grow larger and more intense.
Data reporting by Emma Rubin. Story editing by Brian Budzynski. Copy editing by Tim Bruns. Photo selection by Clarese Moller.
This story originally appeared on Insurify and was produced and
distributed in partnership with Stacker Studio.