Visualizing solar power capacity across the US

VGC // Getty Images
Visualizing solar power capacity across the US
Aerial view of workers installing solar panels.
When Congress passed the Inflation Reduction Act in August 2022, billions of dollars were appropriated and millions of acres were reserved for renewable energy expansion. This unprecedented investment—an estimated $369 billion for climate and energy funding—spurred private industry to get in on the action. Morningstar Direct, as reported by CNBC, found that upwards of $425 million had been invested by private enterprise into U.S. renewable energy exchange-traded funds as of Aug. 12, less than a week before President Biden signed the IRA into law.
One of the most popular forms of sustainable renewable energy is solar power. Solar photovoltaic energy is produced when sunlight is converted into electricity. The most effective way to harness sunlight for electricity on an industrial scale is by planting large silicon panels on solar farms. Large utility-scale solar energy plants have become more affordable and efficient over the decades, and are seeing widespread installation as the green energy boom accelerates, particularly in areas like California and the Southwest.
Solar generation is the fastest-growing renewable energy source. Not only are PV cells looking more attractive to homeowners, but commercial developments have also begun to see the advantage of including solar collection systems in new construction or retrofitting existing structures for solar capability.
The Inflation Reduction Act created the Energy Infrastructure Reinvestment Program, a loan program designed to help communities repurpose existing energy infrastructure such as decommissioned coal plants and oil pipelines, as well as refit homes and businesses with new PV technology.
With solar energy investment now top-of-mind for both government and private enterprise, Rocket Solar compiled data from the Energy Information Administration to analyze solar utility use and development and how it’s grown over the past 30 years.
![]()
Rocket Solar
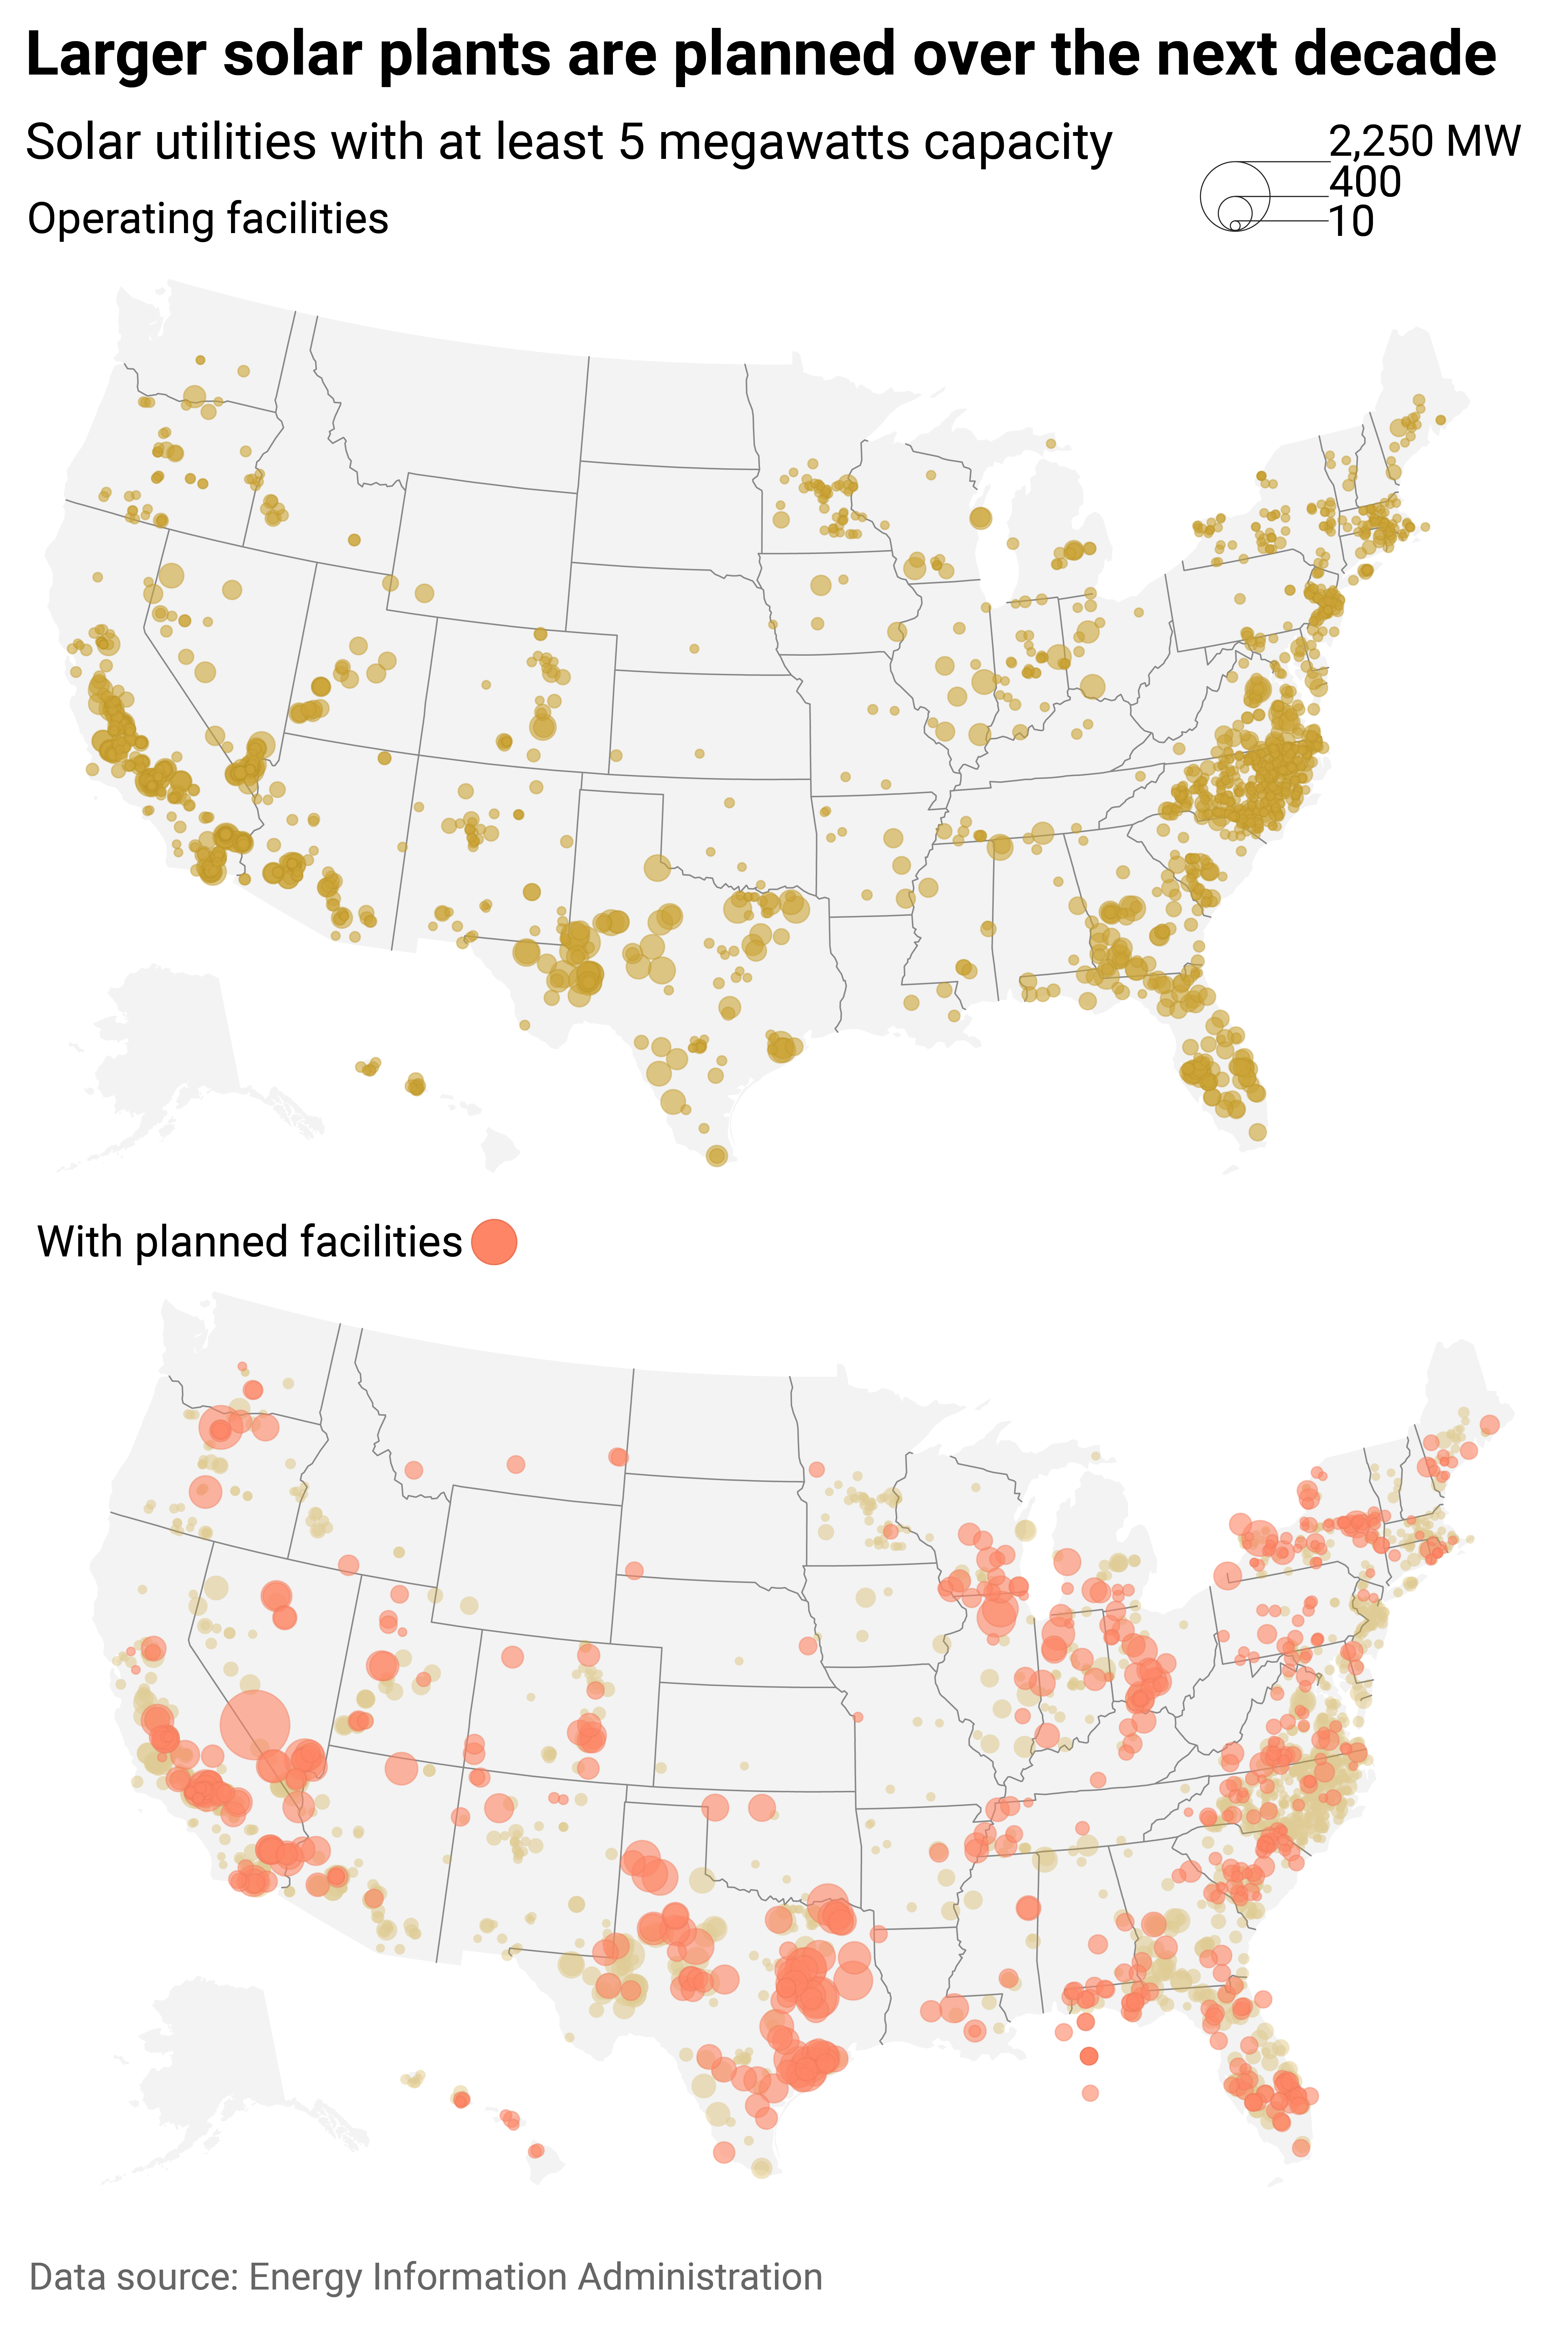
Solar plant locations
Symbol map showing solar utilities in the U.S., clustered in states like California, Texas, and along the East Coast.
In 2021, California’s energy costs were the third highest in the nation, with costs higher only in Hawaii and Alaska. To offset costs and reduce fossil fuel emissions, the Biden administration has dedicated more than 10 million acres of federally protected desert land in the state to solar energy farm development. Most of these acres are in the southern half of the state.
Other areas of the South, most notably Texas, are also in line for new solar installations. Traditionally thought of as oil and gas country, Texas announced plans to add 10 gigawatts (GW) of solar power by the end of 2023, and it did so in the middle of the pandemic amidst burgeoning economic uncertainty. Should the state meet this goal, it would represent one-third of the 30 GW expected to be brought into service nationwide in the coming year.
Rocket Solar
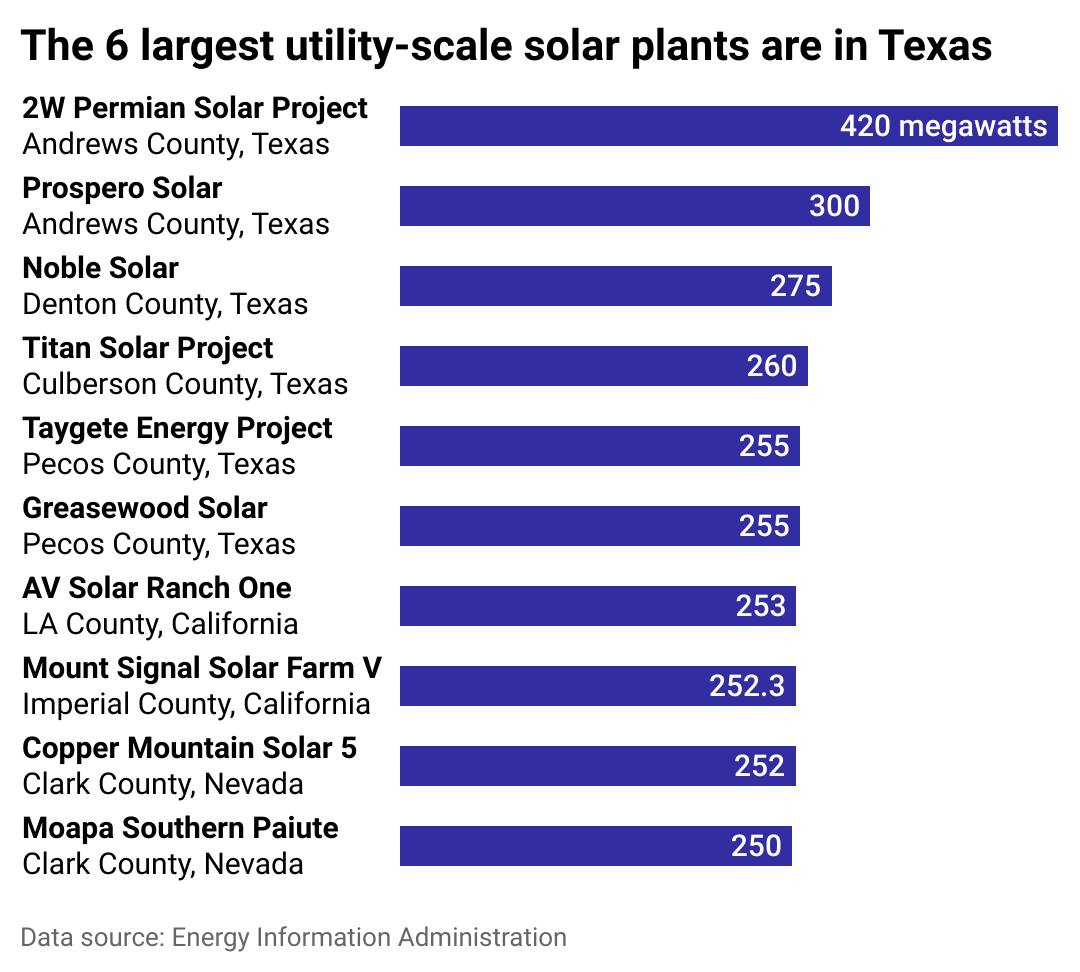
The largest solar utilities in the US
Bar chart of the 10 largest solar utlities in the U.S., all in Texas, California, and Nevada.
Texas both produces and consumes the most electricity of any state, yet its power grid is not as robust as one would expect given that fact, as evidenced by its tragic failure in February 2021 that led to 246 deaths. The Electric Reliability Council of Texas, which operates the state’s electric grid and tracks both wind and solar generation, sees the value in ramping up alternative, renewable energy sources. Giant utility-scale projects prosper in western Texas where intense sun and vast tracts of flat open land create perfect conditions for solar generation.
The state’s largest solar plant, the 2W Permian Solar Project Hybrid, located in Andrews County near the border of New Mexico, holds 1.3 million solar panels and is estimated to be capable of producing enough energy to power more than 80,000 homes. The rurality and generally flat topography of Andrews County lends itself to solar field development, which has drawn corporate attention most recently from Best Buy, which bankrolled the Prospero 2 solar farm in its effort to become carbon neutral by 2040.
Rocket Solar
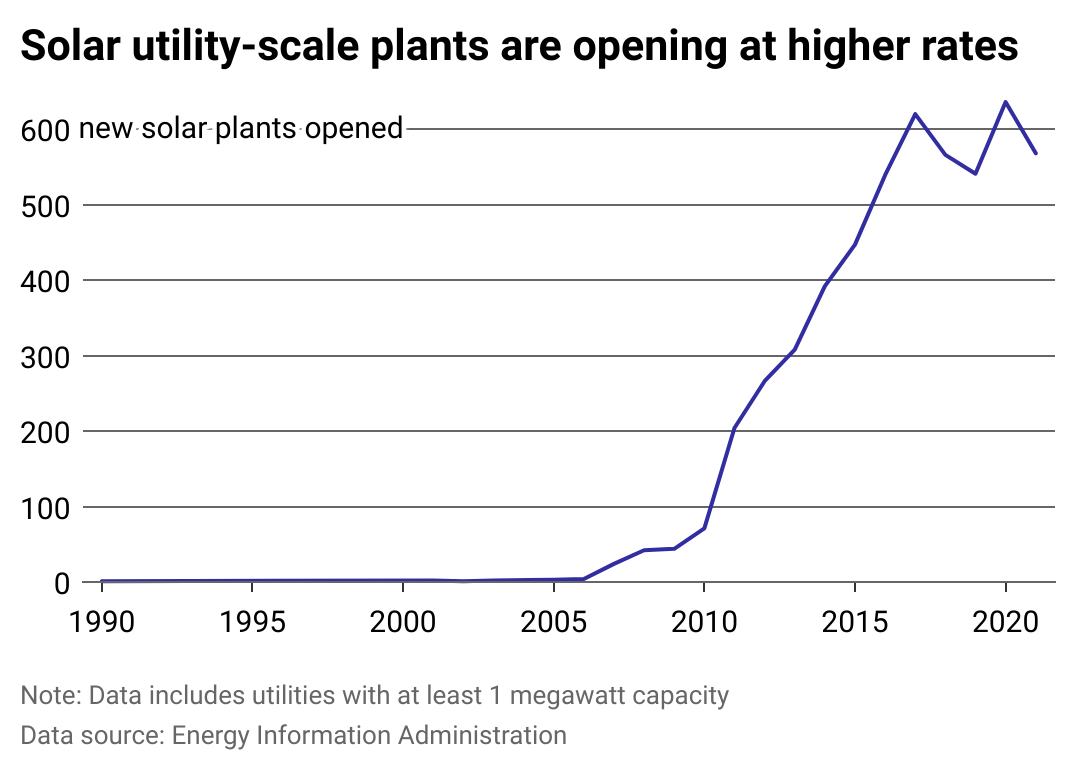
Growth of solar utilities
Line chart of number of solar utilities opened each year. Over 500 began operations in 2021.
In 2006, the California Public Utilities Commission approved a statewide $3 billion plan to subsidize commercial and residential solar installations. A solar cell was developed that finally broke the “40% threshold“—meaning the cell had a sunlight-to-energy conversion of more than 40%. Silicon Valley became a flashpoint for new solar technology development.
In the intervening years, solar plants have grown exponentially in both size and number. In 2010, there were little more than 100 utility-scale plants in the U.S.; as of 2020, that number grew six times larger.
The Infrastructure Investment and Jobs Act of 2021 added $10 million to the Department of Energy’s budget for solar manufacturing and recycling, bringing it to $56 million. International asset management companies, such as Copenhagen Infrastructure Partners K/S, are doubling down on renewable energy resources. CIP announced a partnership with Bank of America Corp. in 2020 to finance the construction of a solar project in Pecos County, Texas, the state that is already the largest source of electricity in the country.
Rocket Solar
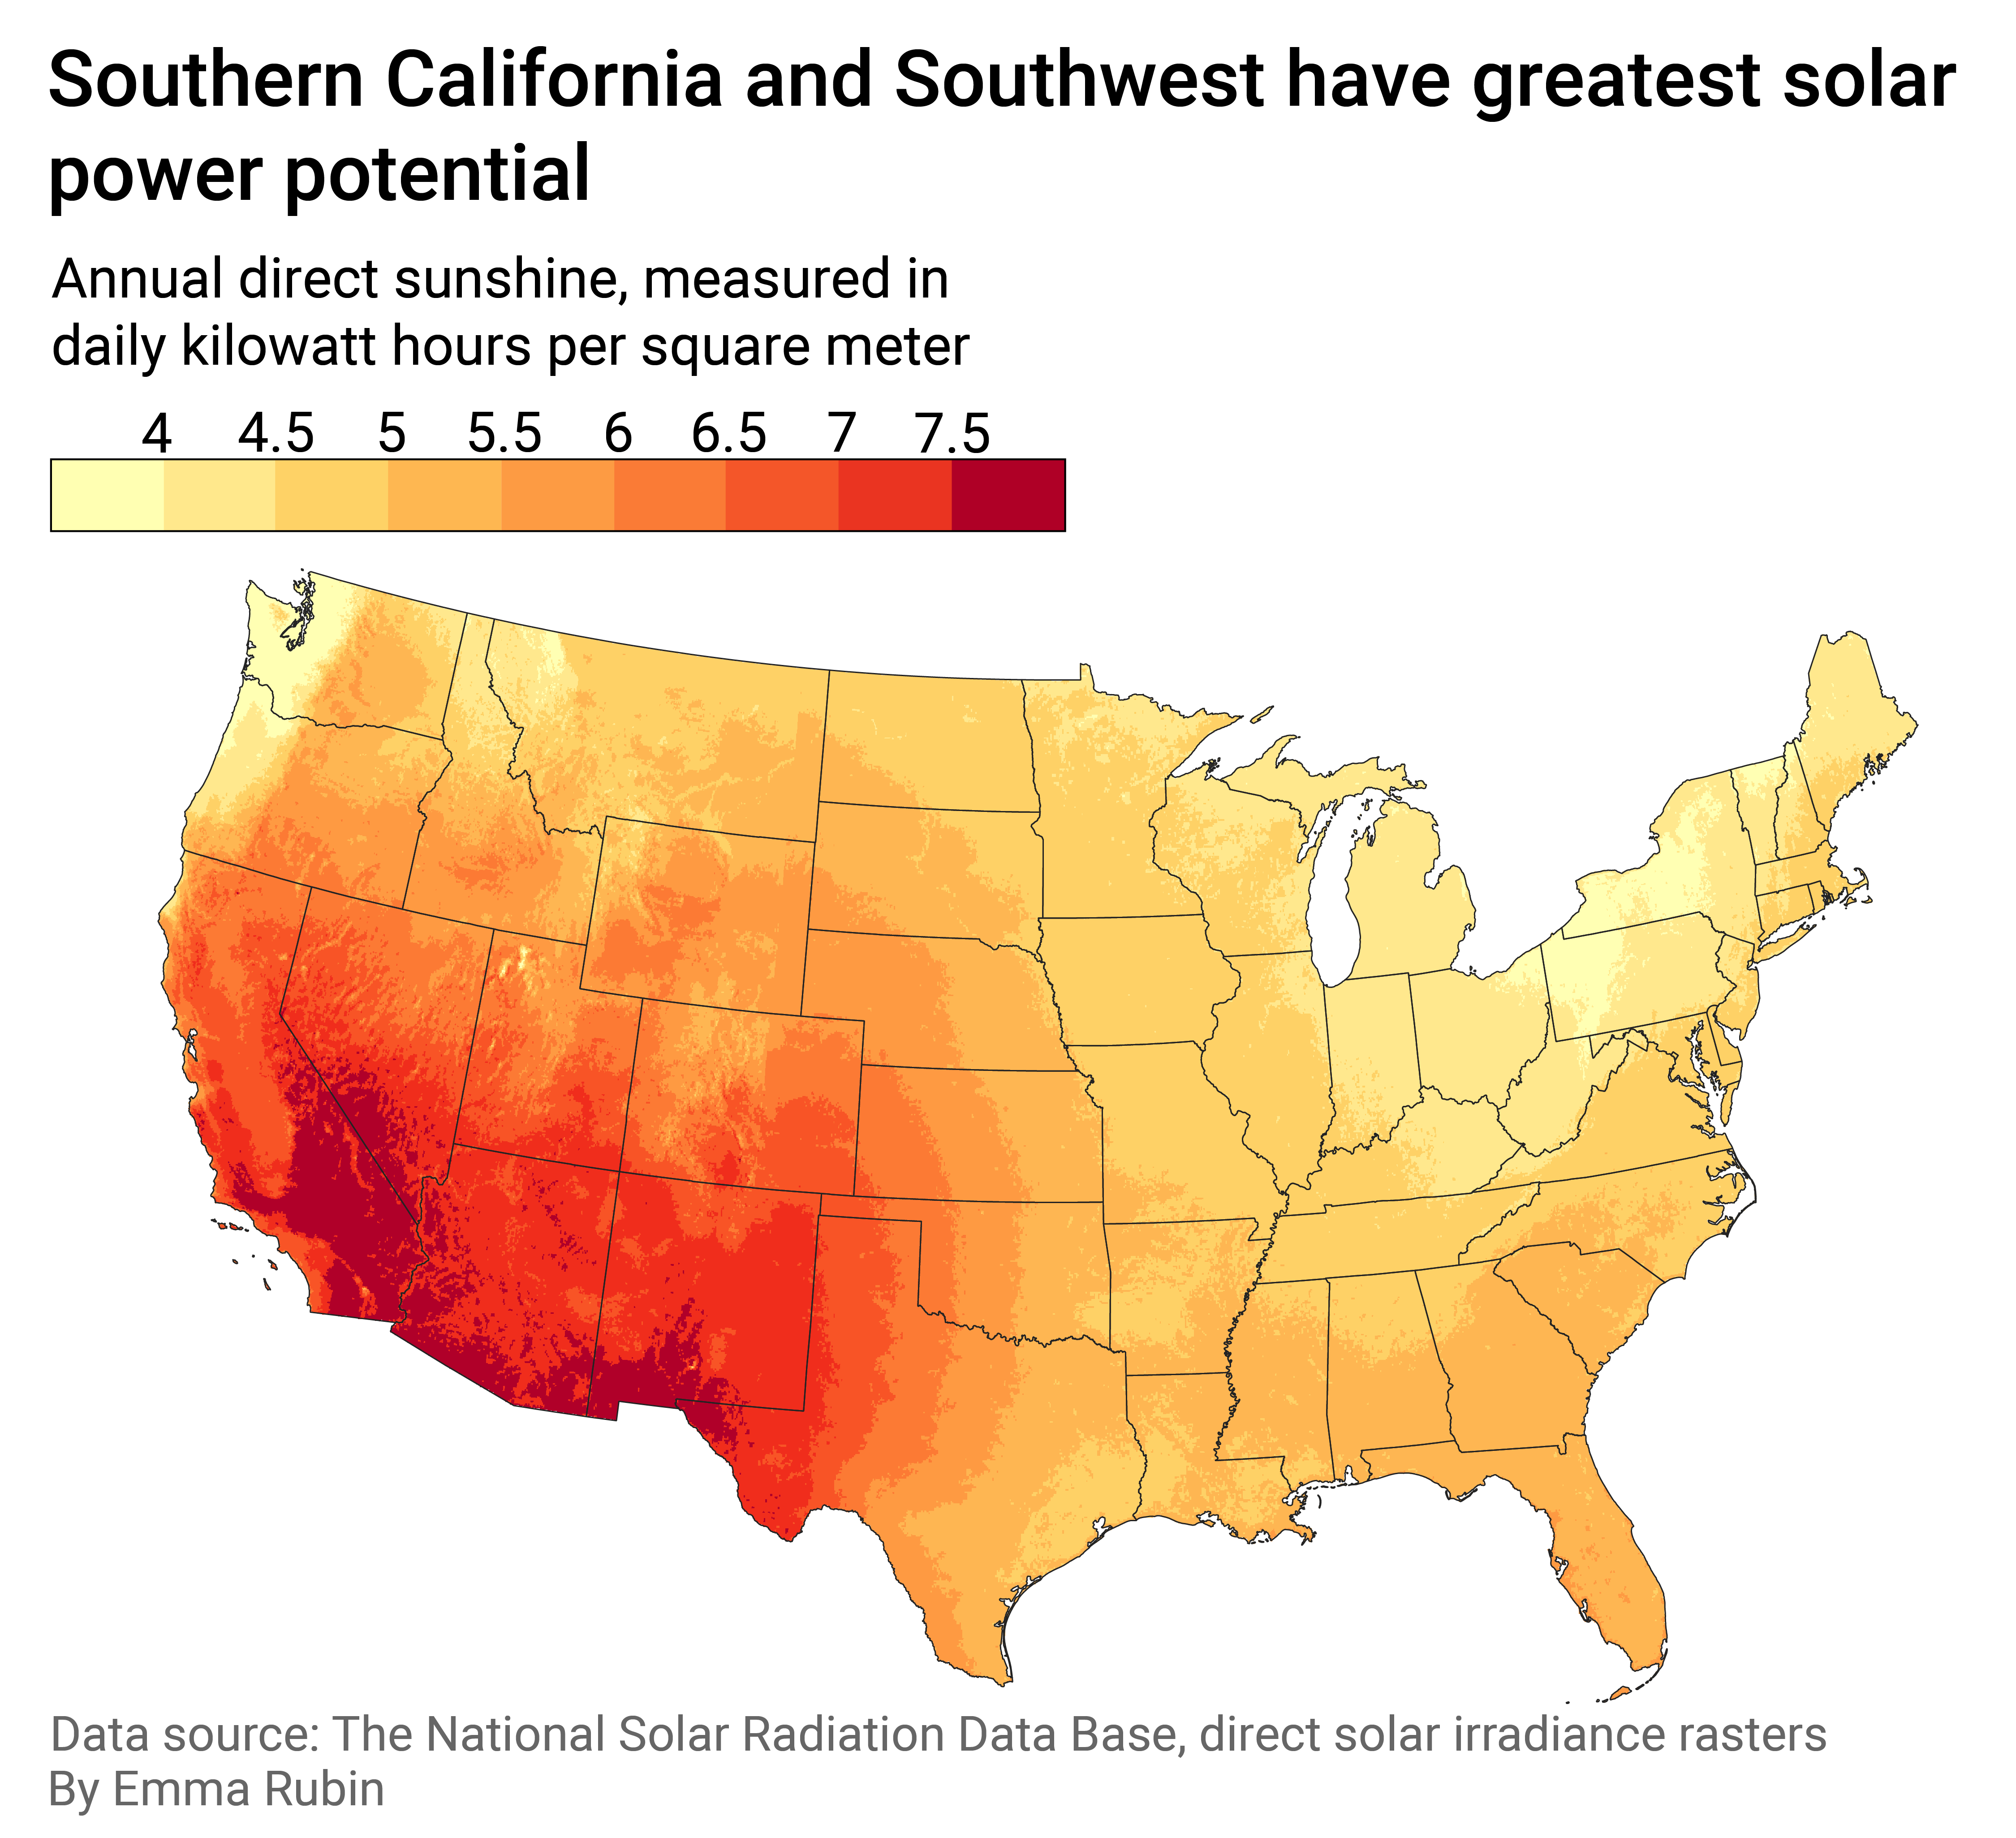
Sunshine across the US
Map of direct normal irradiance in the U.S.
The Southwestern U.S. typically receives the strongest amount of direct sunlight and has, relative to other U.S. regions, less tree canopy and foliage coverage on the ground—as well as generally warmer temperatures. While any area in the U.S. has the potential to harness and benefit from solar power, this Southwest region—which includes parts of California, Nevada, Arizona, Utah, and New Mexico—has the greatest large-scale potential. The region averages between 6.5 to 7.5 daily kilowatt hours (kWh) per square meter, the highest annual direct sunshine in the nation according to the National Solar Radiation Data Base.
Arizona’s solar PV plants, for example, have outperformed solar generation in every other state—but are closely followed by Utah, California, and Nevada. What is particularly telling is the fact that Arizona has just one-fifth the installed capacity of California and yet it outperformed the Golden State from 2014-2017, according to EIA data. PV modules have the greatest capacity for PV power on large tracts of land with direct, high-angle sun exposure, making Southwestern states prime real estate for solar farms.
Regions without year-round sunny weather such as New England or the East Coast still average between 4 to 5 kWh a day per square meter, so don’t count them out entirely. In fact, North Carolina, New Jersey, Massachusetts, and New York are among the top 10 states for solar adoption with the most solar megawatts installed.
This story originally appeared on Rocket Solar and was produced and
distributed in partnership with Stacker Studio.