Where people in San Francisco are moving to most
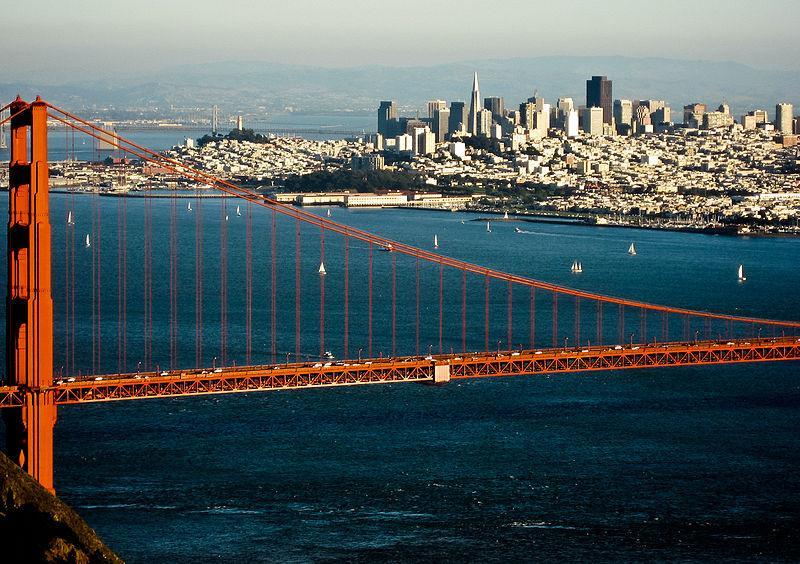
en:User:Paul.h // Wikimedia
Where people in San Francisco are moving to most
Stacker compiled a list of where people in San Francisco-Oakland-Berkeley, CA Metro Area are moving to the most using data from the U.S. Census Bureau. Metros are ranked by the estimated number of people who moved to the metro from San Francisco between 2015 and 2019. Ties were broken by gross migration.
You may also like: Highest-rated brunch restaurants in San Francisco, according to Tripadvisor
![]()

Wikimedia
#50. Oklahoma City, OK Metro Area
– Migration to Oklahoma City in 2015-2019: 541
– Migration from Oklahoma City to San Francisco: 195 (#37 most common destination from Oklahoma City)
– Net migration: 346 to Oklahoma City

PhotosByMahin // Pixabay
#49. Detroit-Warren-Dearborn, MI Metro Area
– Migration to Detroit in 2015-2019: 542
– Migration from Detroit to San Francisco: 672 (#31 most common destination from Detroit)
– Net migration: 130 to San Francisco

Atlpedia// Wikimedia
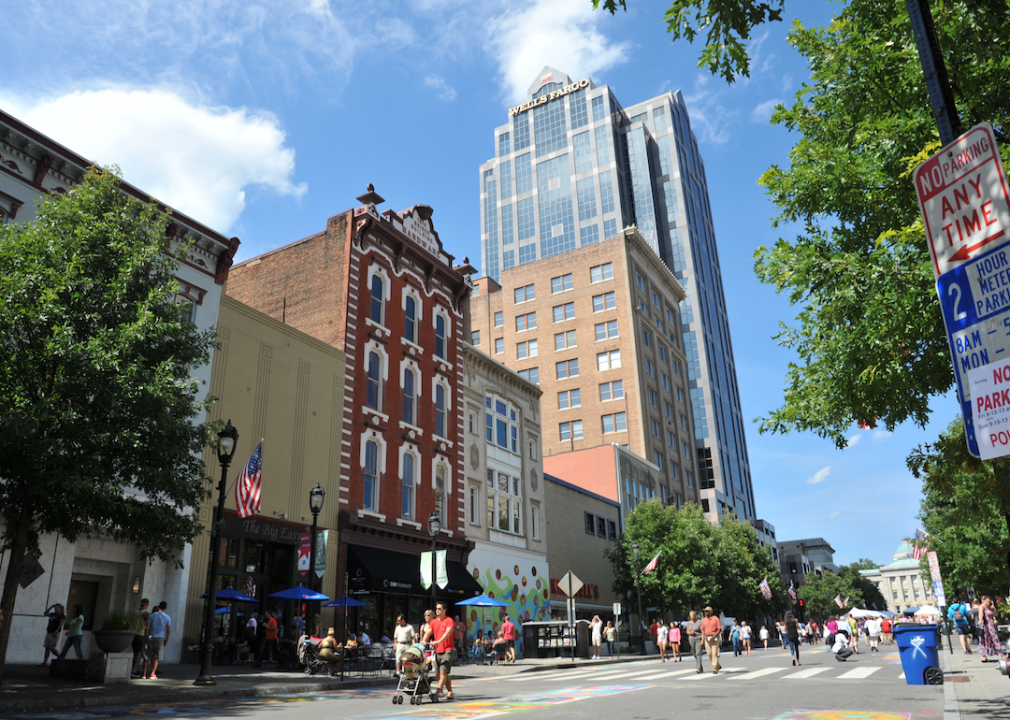
#48. Durham-Chapel Hill, NC Metro Area
– Migration to Durham in 2015-2019: 577
– Migration from Durham to San Francisco: 235 (#29 most common destination from Durham)
– Net migration: 342 to Durham

Sean Pavone // Shutterstock
#47. St. Louis, MO-IL Metro Area
– Migration to St. Louis in 2015-2019: 658
– Migration from St. Louis to San Francisco: 424 (#44 most common destination from St. Louis)
– Net migration: 234 to St. Louis

f11photo // Shutterstock
#46. Nashville-Davidson–Murfreesboro–Franklin, TN Metro Area
– Migration to Nashville in 2015-2019: 676
– Migration from Nashville to San Francisco: 265 (#50 most common destination from Nashville)
– Net migration: 411 to Nashville
You may also like: Highest and lowest paying health care jobs in San Francisco

Doug Kerr // Wikicommons
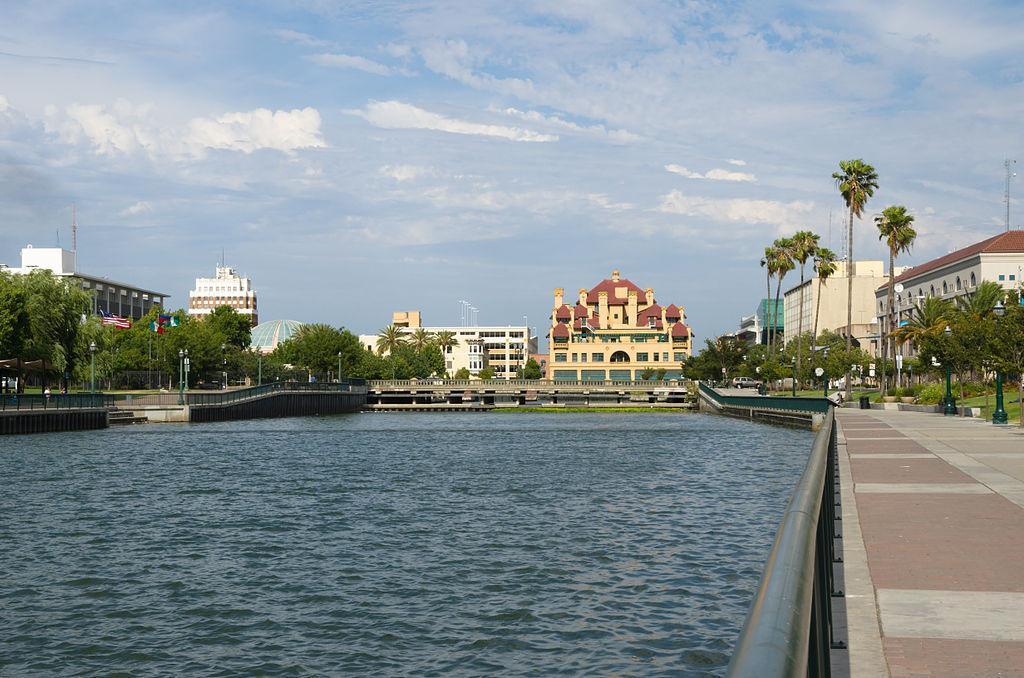
#45. Redding, CA Metro Area
– Migration to Redding in 2015-2019: 700
– Migration from Redding to San Francisco: 157 (#12 most common destination from Redding)
– Net migration: 543 to Redding
Edmund Garman // Flickr
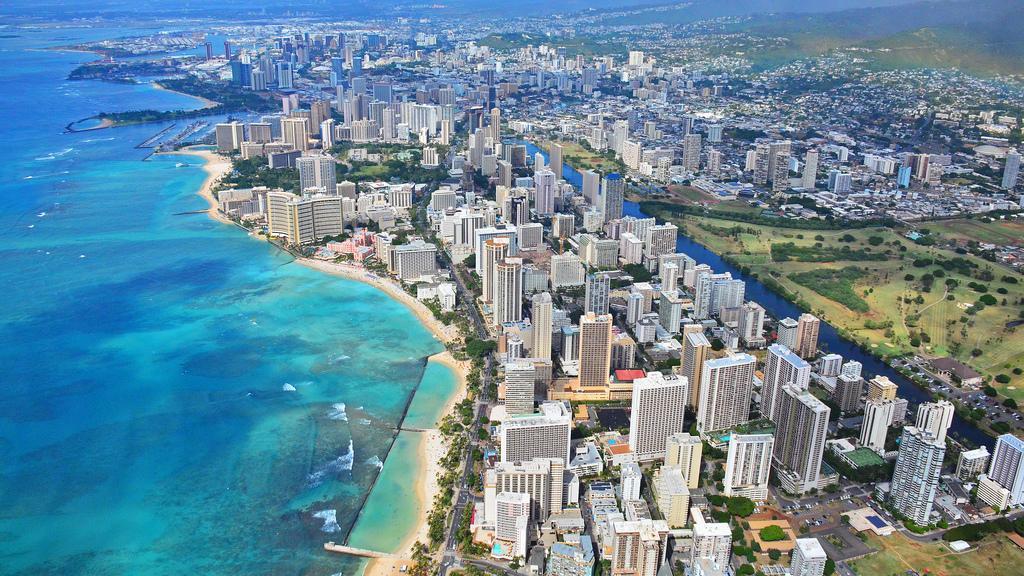
#44. Urban Honolulu, HI Metro Area
– Migration to Urban Honolulu in 2015-2019: 706
– Migration from Urban Honolulu to San Francisco: 925 (#15 most common destination from Urban Honolulu)
– Net migration: 219 to San Francisco
Sharkshock // Shutterstock
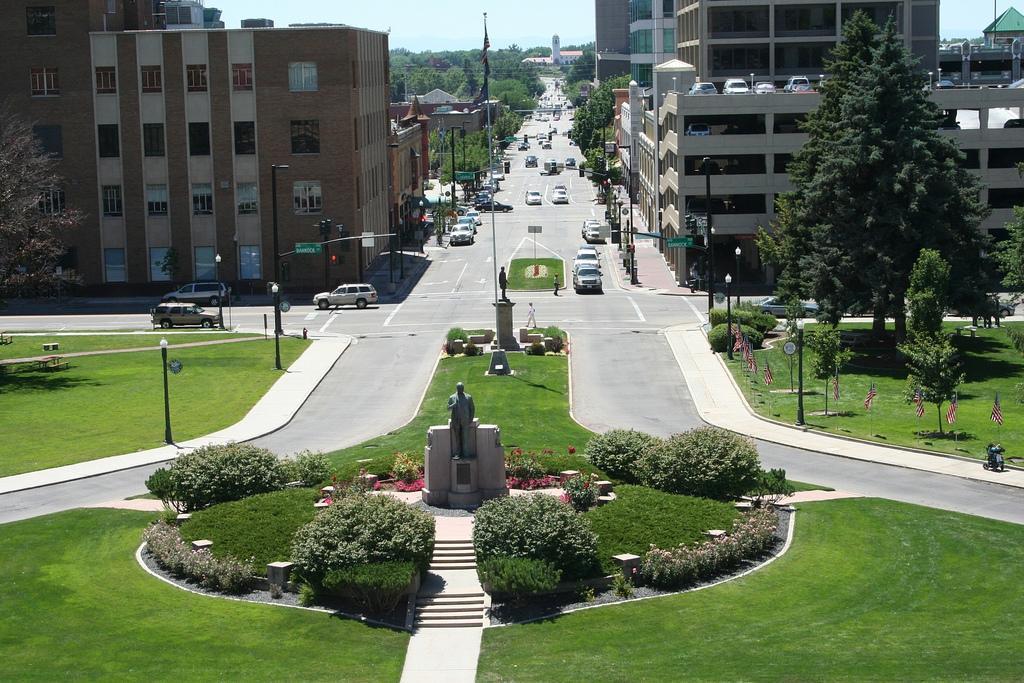
#43. Raleigh-Cary, NC Metro Area
– Migration to Raleigh in 2015-2019: 717
– Migration from Raleigh to San Francisco: 533 (#24 most common destination from Raleigh)
– Net migration: 184 to Raleigh

Canva
#42. Cleveland-Elyria, OH Metro Area
– Migration to Cleveland in 2015-2019: 732
– Migration from Cleveland to San Francisco: 400 (#29 most common destination from Cleveland)
– Net migration: 332 to Cleveland
Tony Webster // Wikicommons
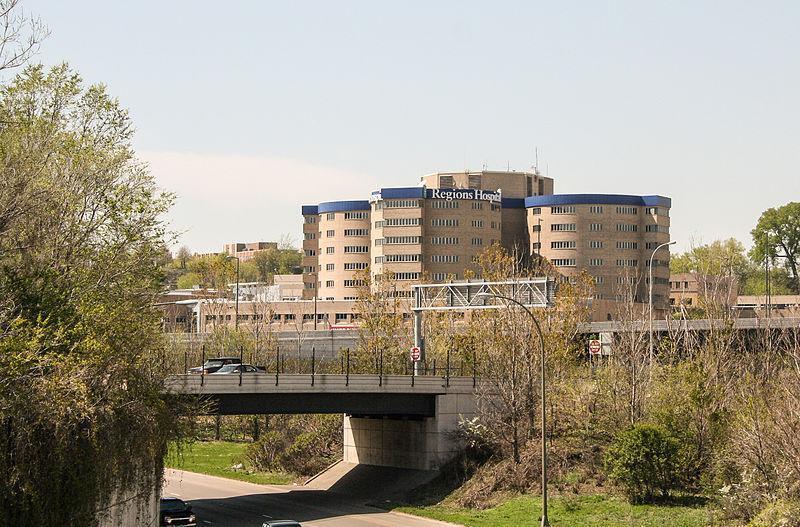
#41. Minneapolis-St. Paul-Bloomington, MN-WI Metro Area
– Migration to Minneapolis in 2015-2019: 739
– Migration from Minneapolis to San Francisco: 799 (#24 most common destination from Minneapolis)
– Net migration: 60 to San Francisco
You may also like: Highest paying jobs in San Francisco that require a graduate degree
Lauram12345 // Wikicommons
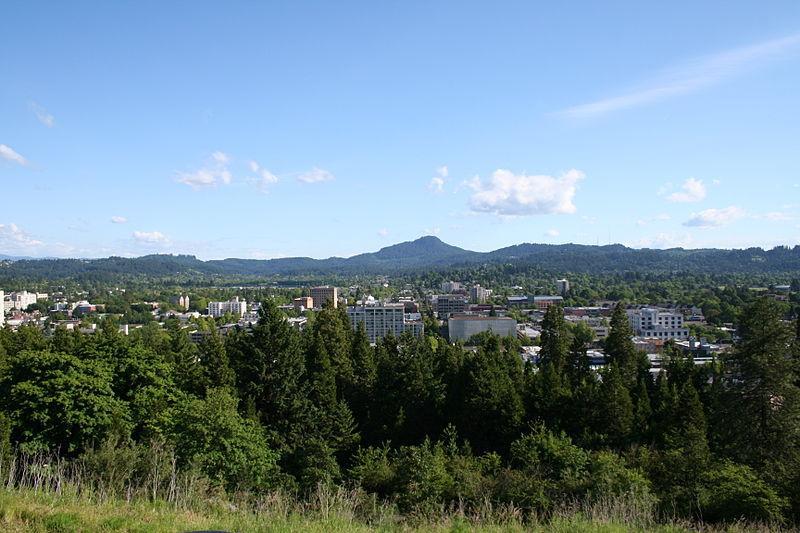
#40. Eugene-Springfield, OR Metro Area
– Migration to Eugene in 2015-2019: 750
– Migration from Eugene to San Francisco: 417 (#8 most common destination from Eugene)
– Net migration: 333 to Eugene
CameronK23 // Wikimedia Commons
#39. Oxnard-Thousand Oaks-Ventura, CA Metro Area
– Migration to Oxnard in 2015-2019: 872
– Migration from Oxnard to San Francisco: 881 (#8 most common destination from Oxnard)
– Net migration: 9 to San Francisco
nickchapman // Wikicommons
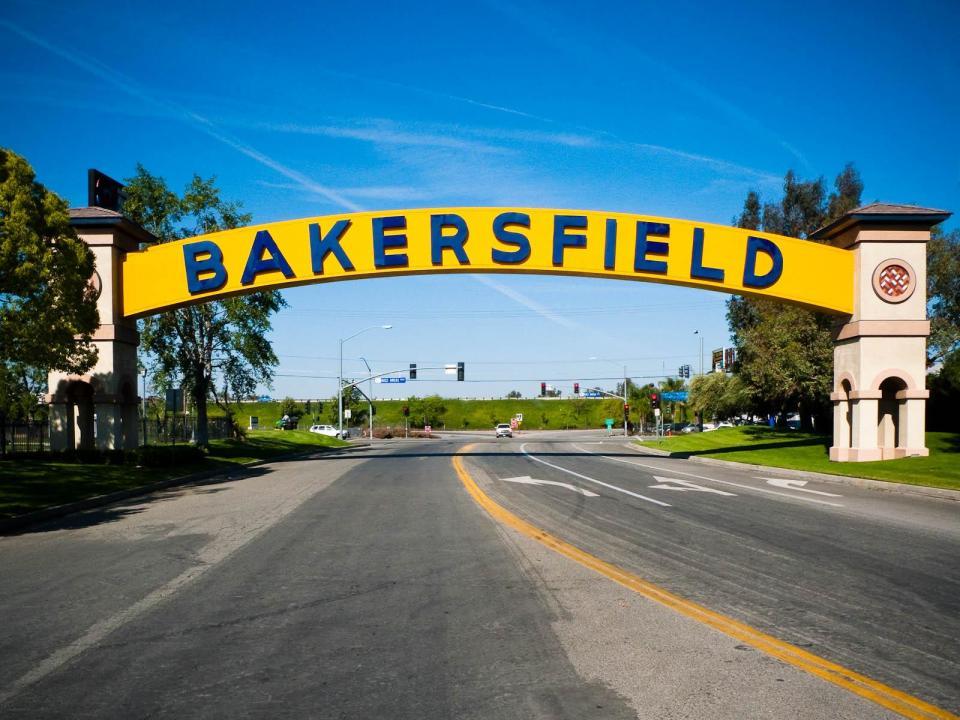
#38. Bakersfield, CA Metro Area
– Migration to Bakersfield in 2015-2019: 873
– Migration from Bakersfield to San Francisco: 471 (#13 most common destination from Bakersfield)
– Net migration: 402 to Bakersfield
Zereshk // Wikimedia
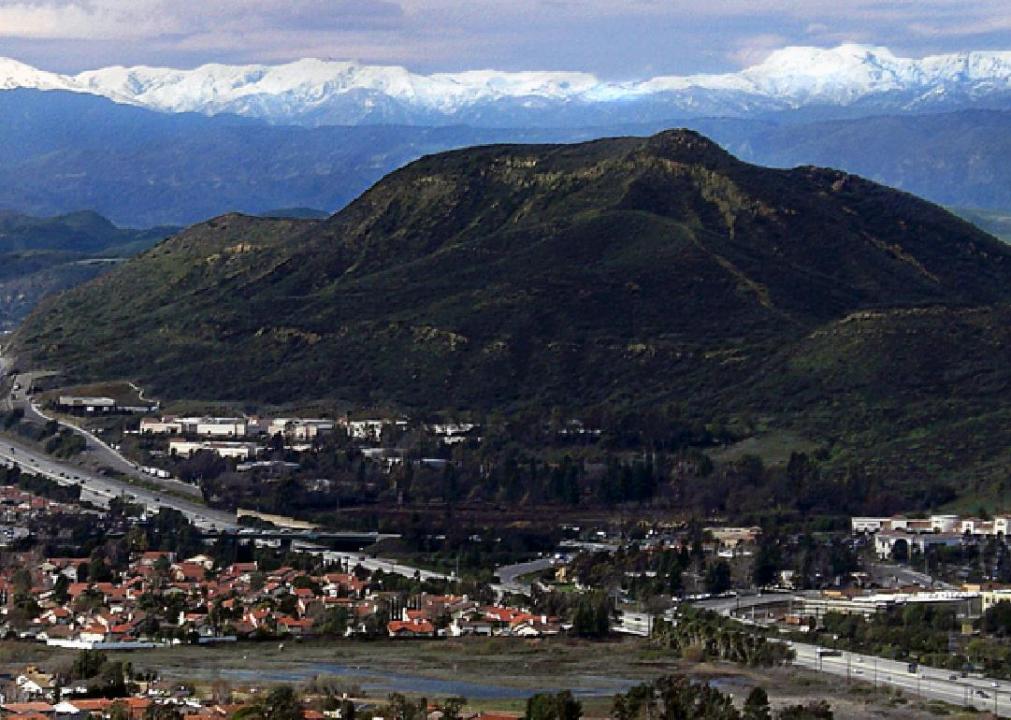
#37. Tucson, AZ Metro Area
– Migration to Tucson in 2015-2019: 877
– Migration from Tucson to San Francisco: 521 (#14 most common destination from Tucson)
– Net migration: 356 to Tucson

Arina P Habich // Shutterstock
#36. Boulder, CO Metro Area
– Migration to Boulder in 2015-2019: 971
– Migration from Boulder to San Francisco: 352 (#8 most common destination from Boulder)
– Net migration: 619 to Boulder
You may also like: Highest-rated fine dining restaurants in San Francisco, according to Tripadvisor
Kolossos // Wikimedia Commons
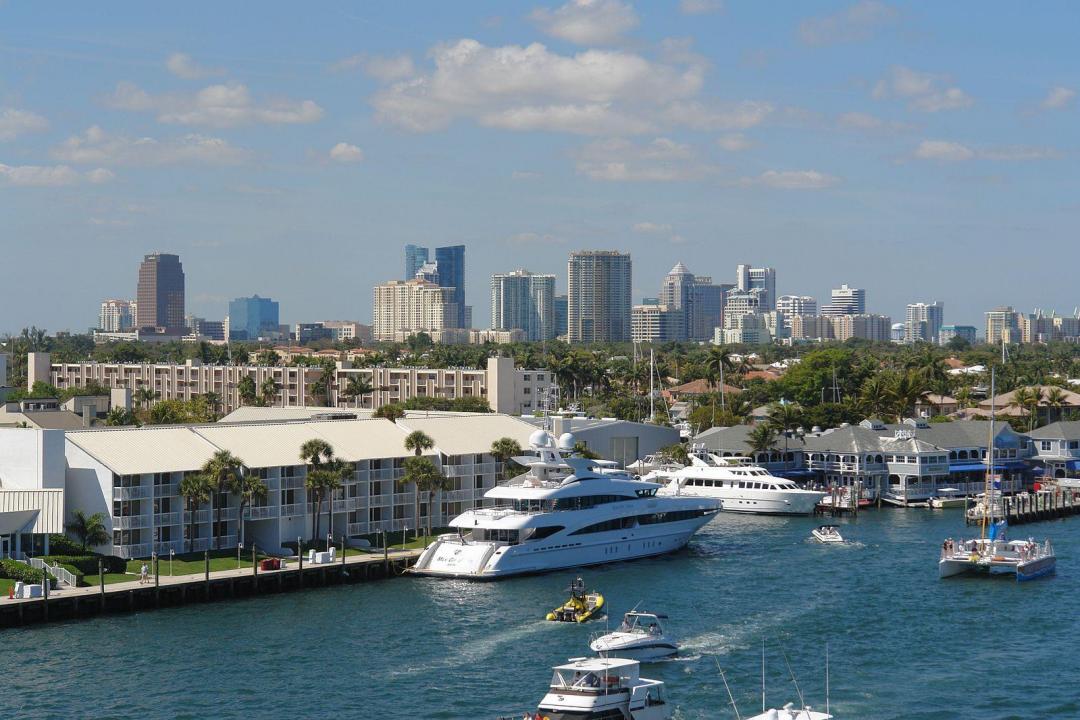
#35. Miami-Fort Lauderdale-Pompano Beach, FL Metro Area
– Migration to Miami in 2015-2019: 998
– Migration from Miami to San Francisco: 1,605 (#24 most common destination from Miami)
– Net migration: 607 to San Francisco
Boise Metro Chamber // Flickr
#34. Boise City, ID Metro Area
– Migration to Boise City in 2015-2019: 999
– Migration from Boise City to San Francisco: 235 (#19 most common destination from Boise City)
– Net migration: 764 to Boise City
Skyguy414 // Wikicommons
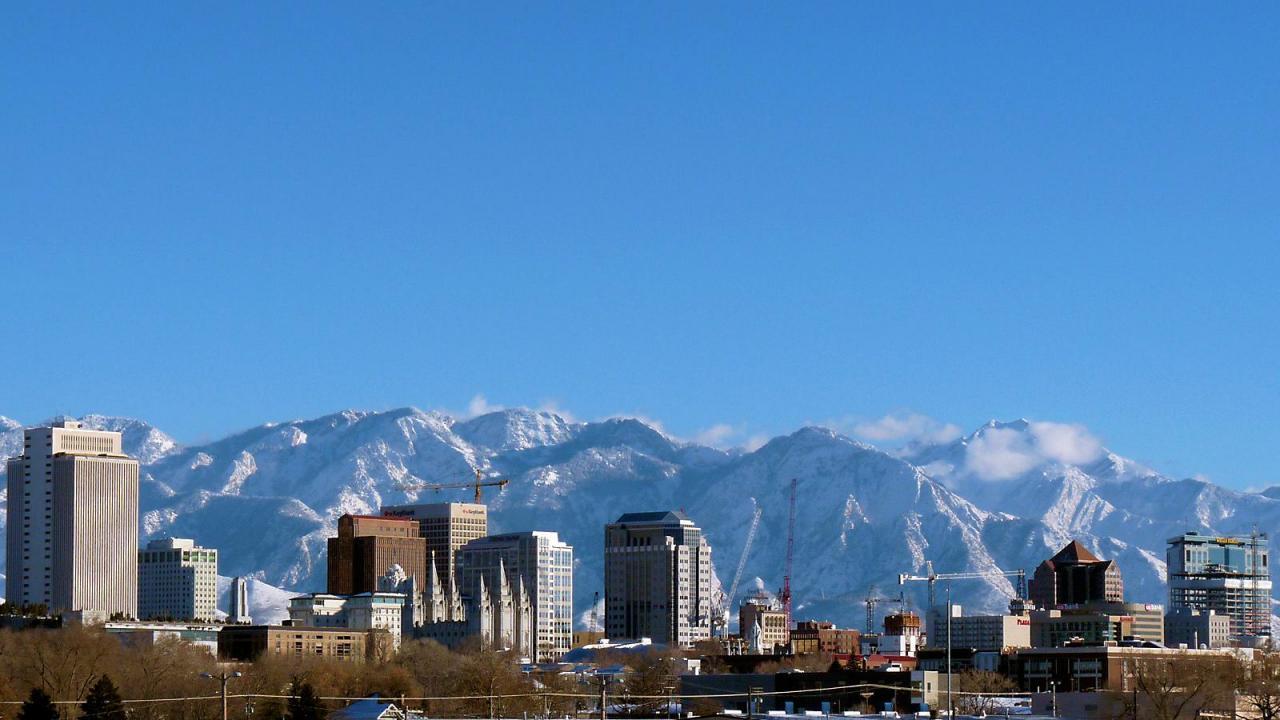
#33. Salt Lake City, UT Metro Area
– Migration to Salt Lake City in 2015-2019: 1,039
– Migration from Salt Lake City to San Francisco: 408 (#21 most common destination from Salt Lake City)
– Net migration: 631 to Salt Lake City

f11photo // Shutterstock
#32. Philadelphia-Camden-Wilmington, PA-NJ-DE-MD Metro Area
– Migration to Philadelphia in 2015-2019: 1,142
– Migration from Philadelphia to San Francisco: 1,345 (#34 most common destination from Philadelphia)
– Net migration: 203 to San Francisco

Stan Shebs // Wikicommons
#31. Napa, CA Metro Area
– Migration to Napa in 2015-2019: 1,237
– Migration from Napa to San Francisco: 881 (#2 most common destination from Napa)
– Net migration: 356 to Napa
You may also like: Highest-rated seafood restaurants in San Francisco, according to Tripadvisor

Keizers // Wikimedia Commons
#30. Atlanta-Sandy Springs-Alpharetta, GA Metro Area
– Migration to Atlanta in 2015-2019: 1,242
– Migration from Atlanta to San Francisco: 1,399 (#32 most common destination from Atlanta)
– Net migration: 157 to San Francisco
Naotake Murayama // Wikicommons
#29. Salinas, CA Metro Area
– Migration to Salinas in 2015-2019: 1,293
– Migration from Salinas to San Francisco: 847 (#4 most common destination from Salinas)
– Net migration: 446 to Salinas
Mark Miller // Wikicommons
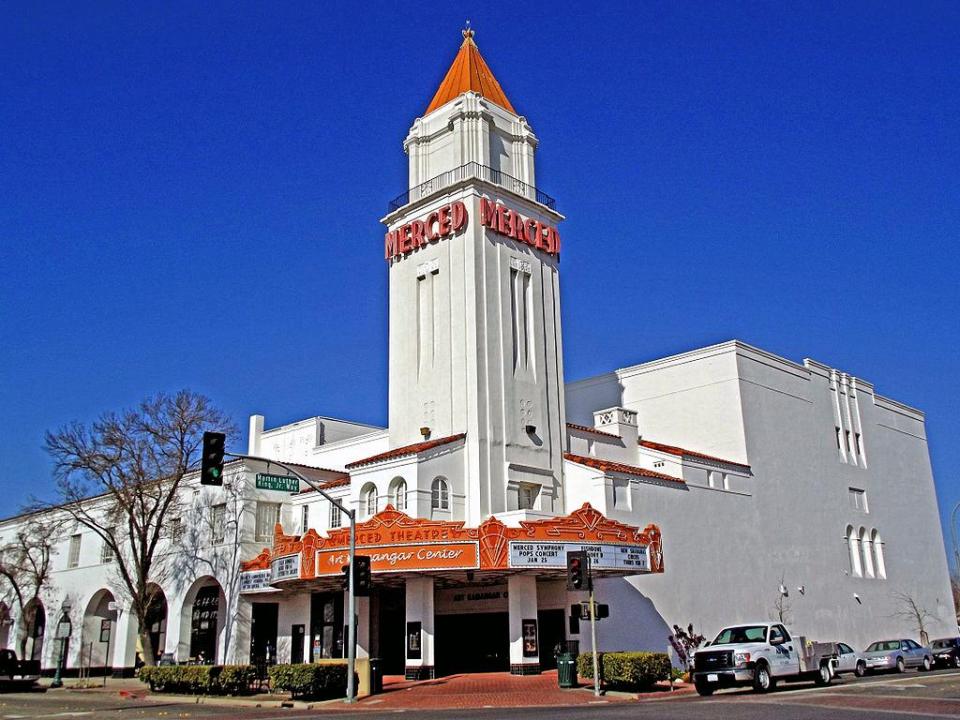
#28. Merced, CA Metro Area
– Migration to Merced in 2015-2019: 1,648
– Migration from Merced to San Francisco: 558 (#7 most common destination from Merced)
– Net migration: 1,090 to Merced
Lómelinde // Wikicommons
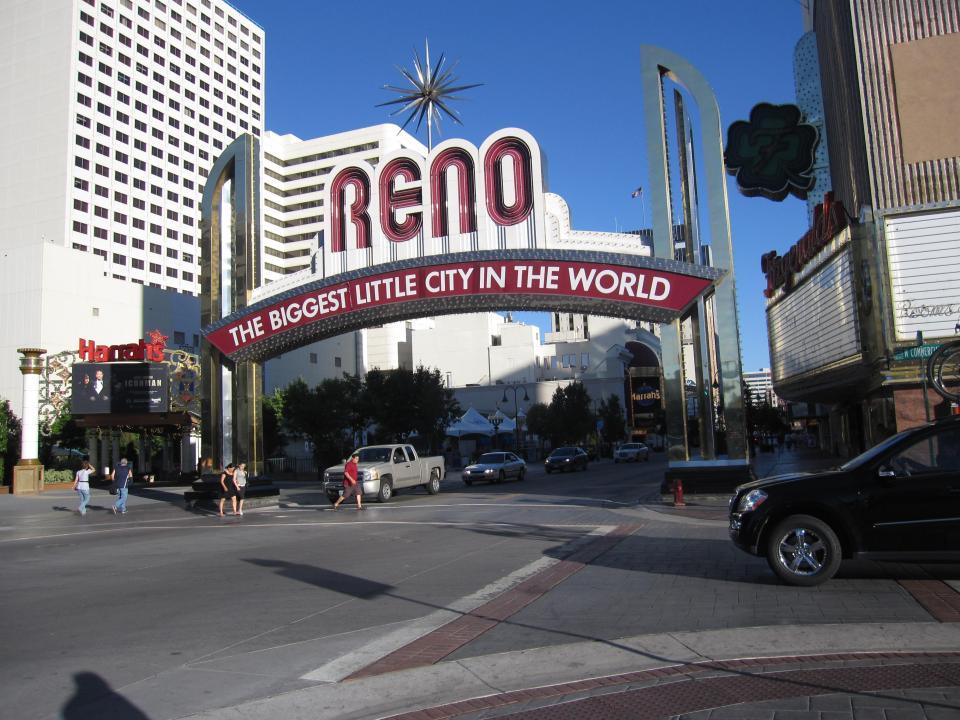
#27. Reno, NV Metro Area
– Migration to Reno in 2015-2019: 1,665
– Migration from Reno to San Francisco: 569 (#5 most common destination from Reno)
– Net migration: 1,096 to Reno

Pixabay
#26. Austin-Round Rock-Georgetown, TX Metro Area
– Migration to Austin in 2015-2019: 1,850
– Migration from Austin to San Francisco: 930 (#16 most common destination from Austin)
– Net migration: 920 to Austin
You may also like: Highest and lowest paying education jobs in San Francisco
Basar // Wikicommons
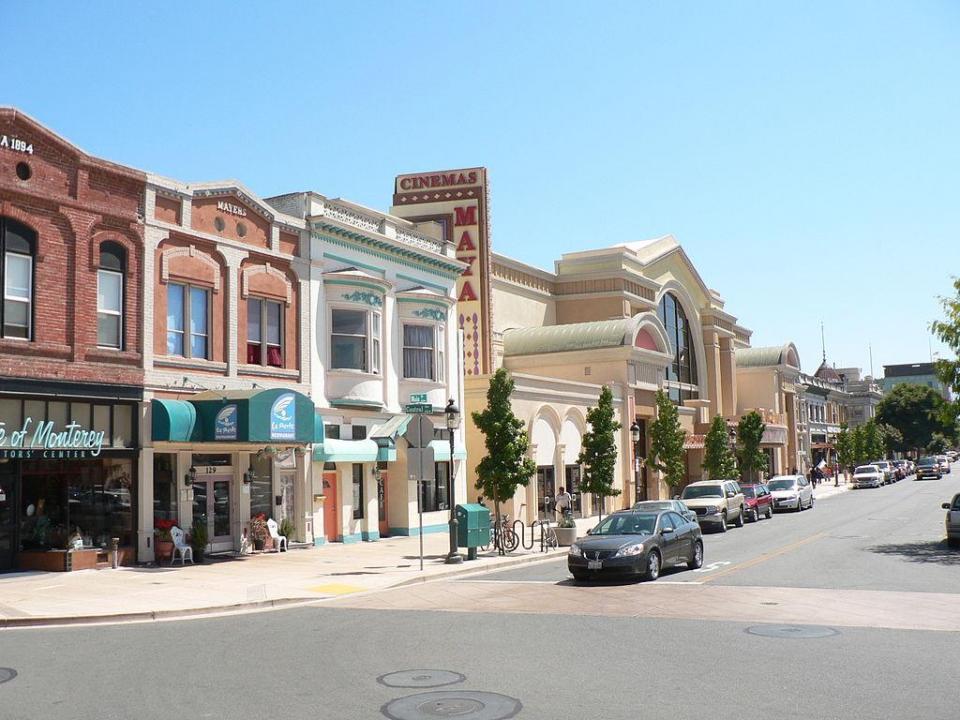
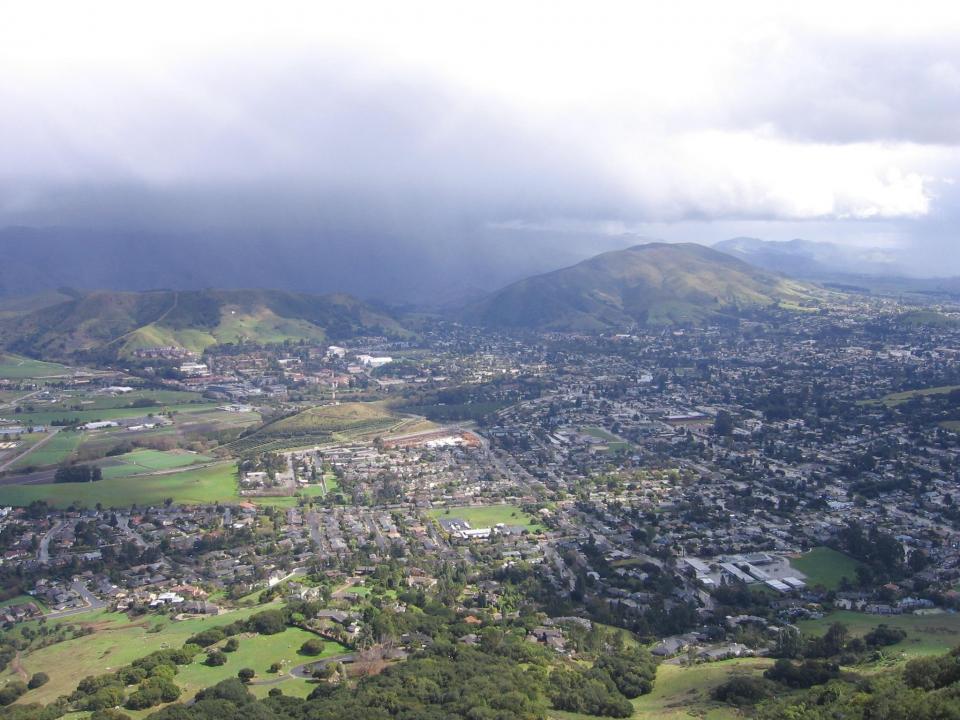
#25. San Luis Obispo-Paso Robles, CA Metro Area
– Migration to San Luis Obispo in 2015-2019: 1,865
– Migration from San Luis Obispo to San Francisco: 1,115 (#3 most common destination from San Luis Obispo)
– Net migration: 750 to San Luis Obispo
skeeze // Pixabay
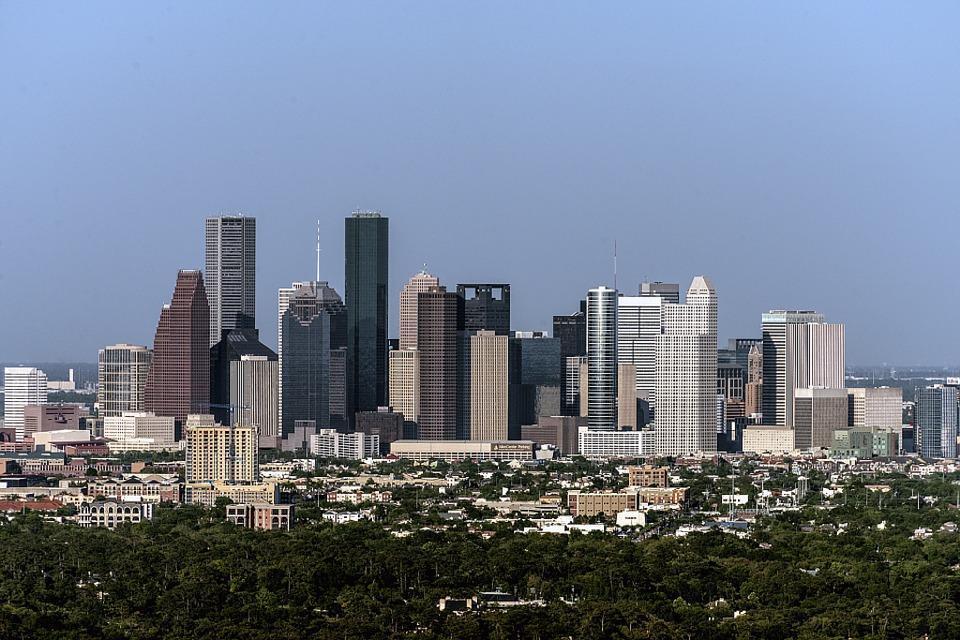
#24. Houston-The Woodlands-Sugar Land, TX Metro Area
– Migration to Houston in 2015-2019: 2,093
– Migration from Houston to San Francisco: 1,602 (#19 most common destination from Houston)
– Net migration: 491 to Houston
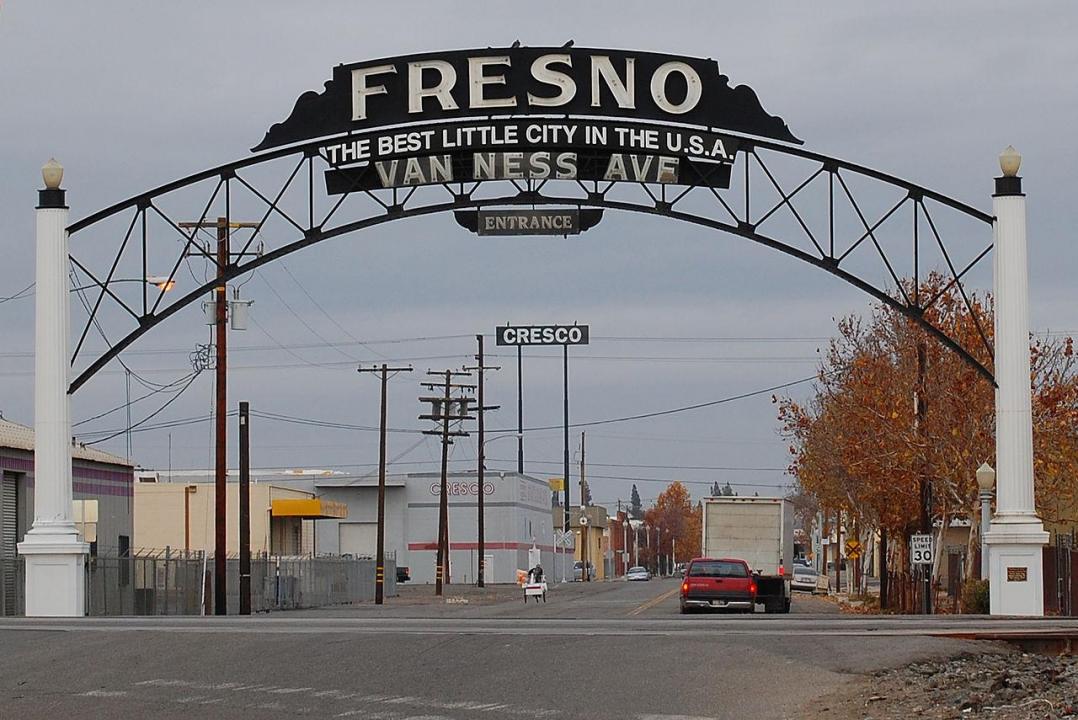
David Jordan // Wikicommons
#23. Fresno, CA Metro Area
– Migration to Fresno in 2015-2019: 2,343
– Migration from Fresno to San Francisco: 1,763 (#4 most common destination from Fresno)
– Net migration: 580 to Fresno

randy andy // Shutterstock
#22. Las Vegas-Henderson-Paradise, NV Metro Area
– Migration to Las Vegas in 2015-2019: 2,353
– Migration from Las Vegas to San Francisco: 1,282 (#10 most common destination from Las Vegas)
– Net migration: 1,071 to Las Vegas

Andrew Bossi // Wikimedia
#21. Washington-Arlington-Alexandria, DC-VA-MD-WV Metro Area
– Migration to Washington in 2015-2019: 2,368
– Migration from Washington to San Francisco: 3,444 (#18 most common destination from Washington)
– Net migration: 1,076 to San Francisco
You may also like: Closest national parks to San Francisco

f11photo // Shutterstock
#20. Denver-Aurora-Lakewood, CO Metro Area
– Migration to Denver in 2015-2019: 2,531
– Migration from Denver to San Francisco: 1,272 (#17 most common destination from Denver)
– Net migration: 1,259 to Denver
Daderot // Wikicommons
#19. Chico, CA Metro Area
– Migration to Chico in 2015-2019: 2,606
– Migration from Chico to San Francisco: 2,009 (#2 most common destination from Chico)
– Net migration: 597 to Chico
Pixabay
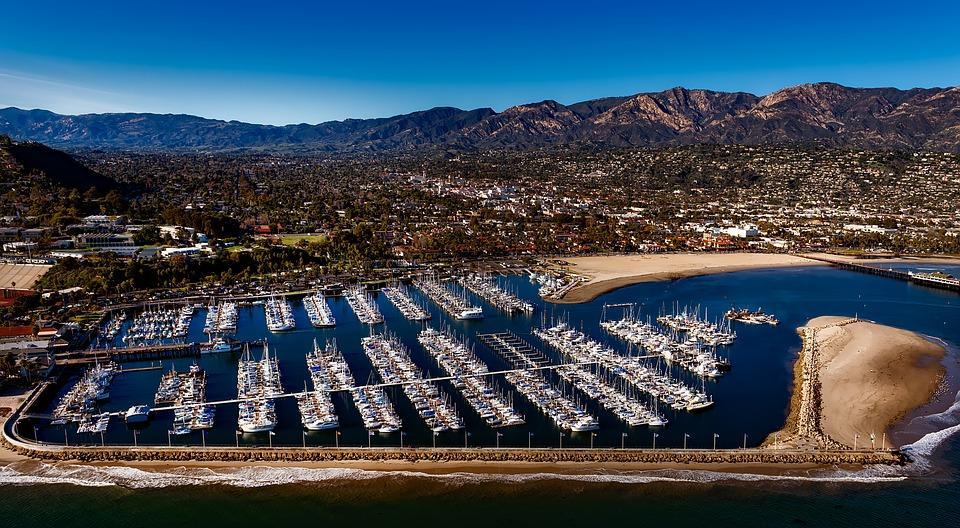
#18. Santa Maria-Santa Barbara, CA Metro Area
– Migration to Santa Maria in 2015-2019: 2,657
– Migration from Santa Maria to San Francisco: 1,211 (#4 most common destination from Santa Maria)
– Net migration: 1,446 to Santa Maria

Christopher & Amy Esposito // Wikicommons
#17. Chicago-Naperville-Elgin, IL-IN-WI Metro Area
– Migration to Chicago in 2015-2019: 2,811
– Migration from Chicago to San Francisco: 4,370 (#14 most common destination from Chicago)
– Net migration: 1,559 to San Francisco

Sean Pavone // Shutterstock
#16. Boston-Cambridge-Newton, MA-NH Metro Area
– Migration to Boston in 2015-2019: 2,903
– Migration from Boston to San Francisco: 2,897 (#10 most common destination from Boston)
– Net migration: 6 to Boston
You may also like: Highest-rated steakhouses in San Francisco, according to Tripadvisor

DPPed// Wikimedia
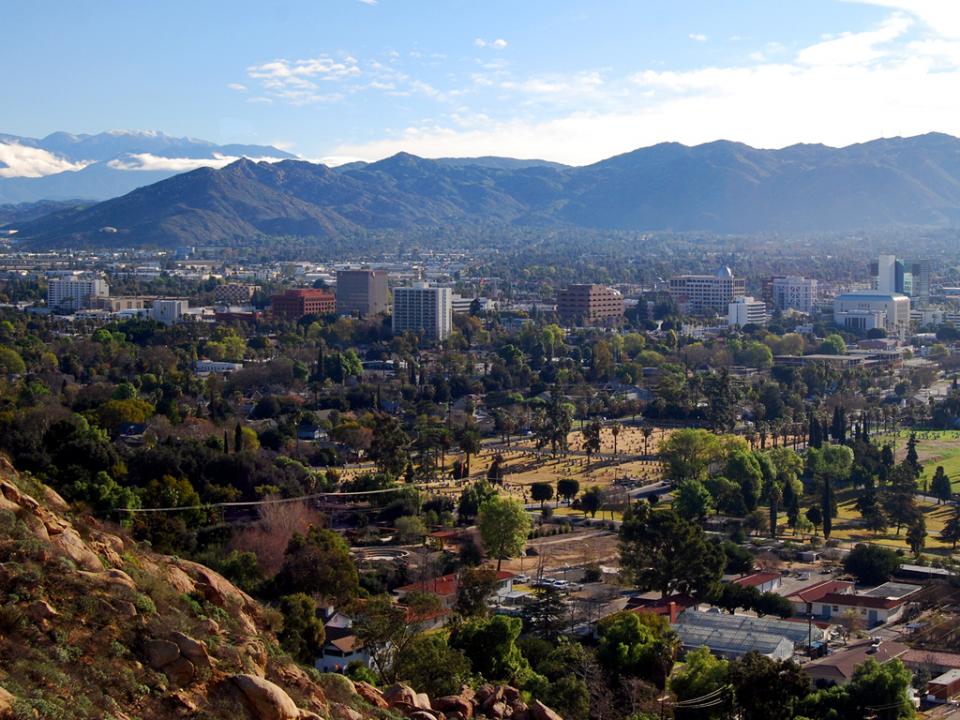
#15. Phoenix-Mesa-Chandler, AZ Metro Area
– Migration to Phoenix in 2015-2019: 3,031
– Migration from Phoenix to San Francisco: 1,731 (#18 most common destination from Phoenix)
– Net migration: 1,300 to Phoenix
Aaronbrick // Wikicommons
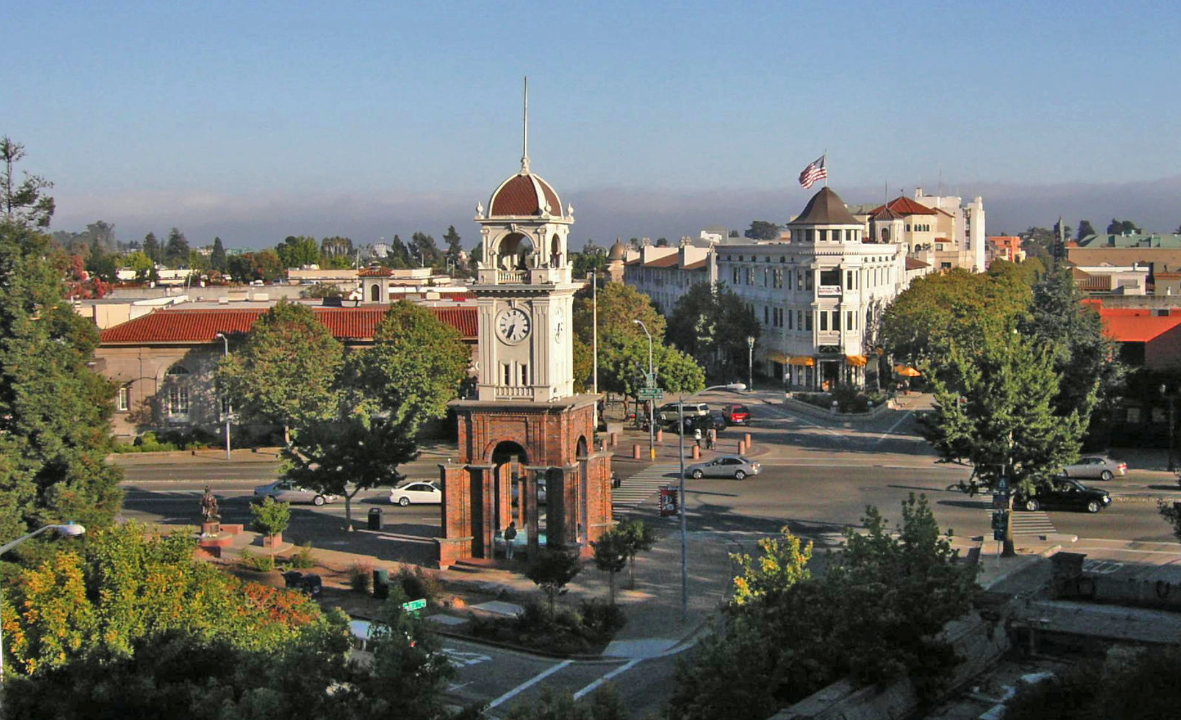
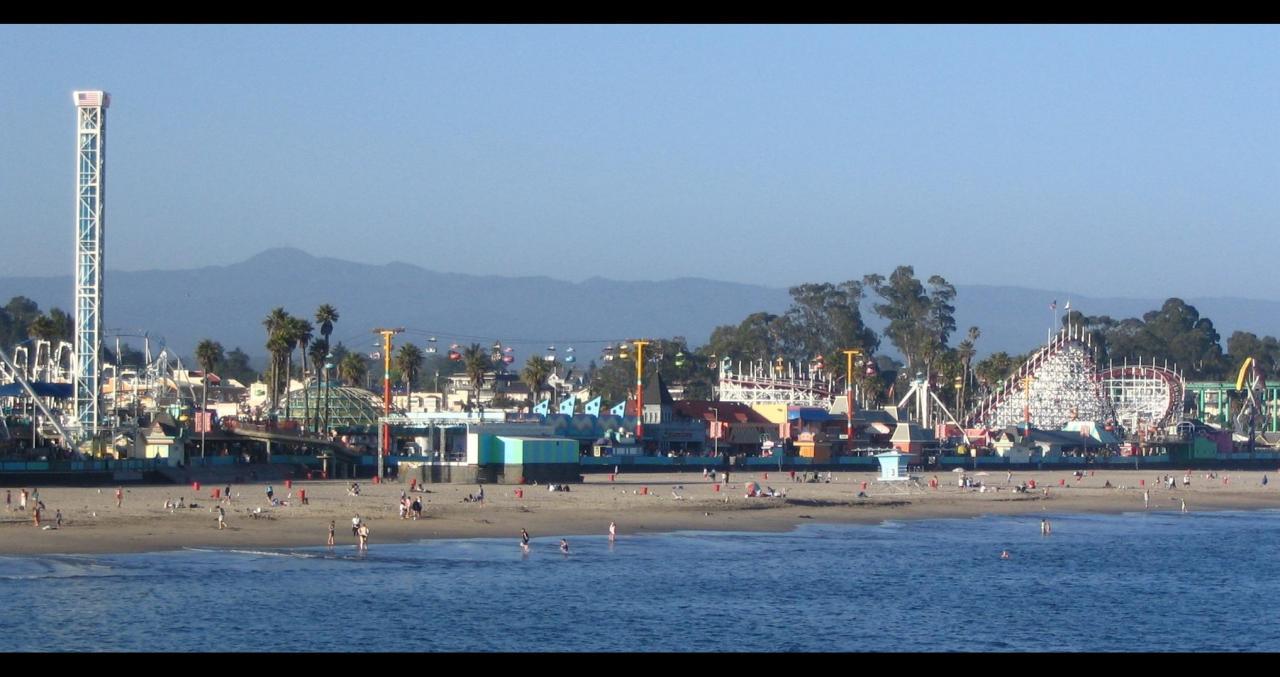
#14. Santa Cruz-Watsonville, CA Metro Area
– Migration to Santa Cruz in 2015-2019: 3,360
– Migration from Santa Cruz to San Francisco: 2,078 (#2 most common destination from Santa Cruz)
– Net migration: 1,282 to Santa Cruz
Public Domain
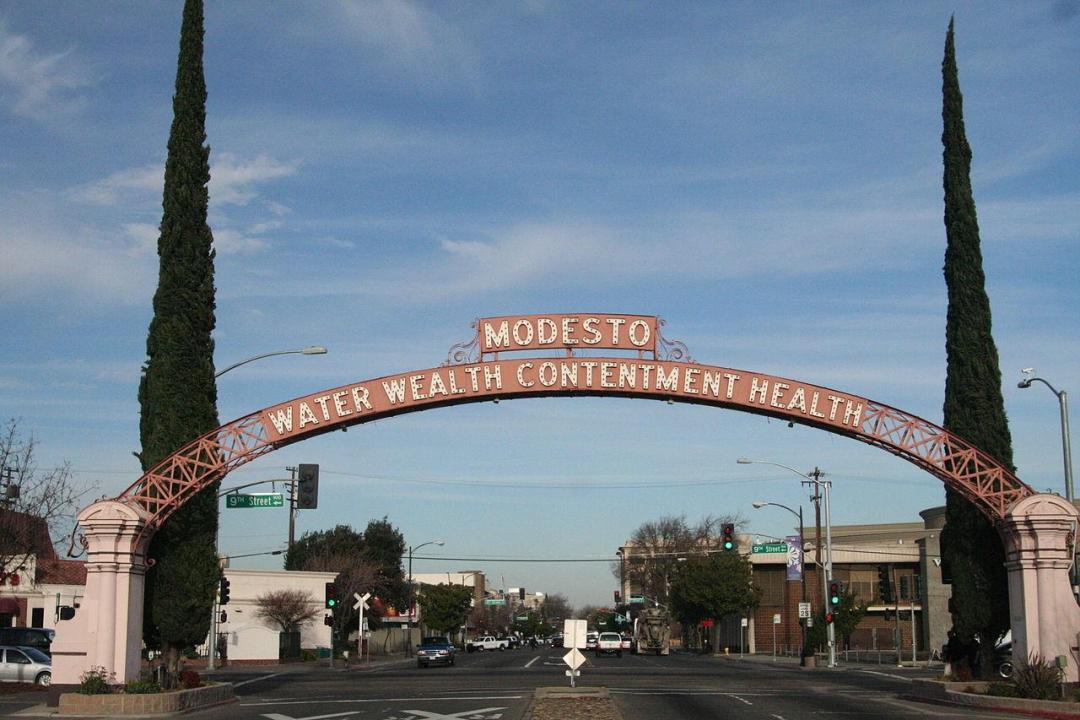
#13. Modesto, CA Metro Area
– Migration to Modesto in 2015-2019: 3,477
– Migration from Modesto to San Francisco: 1,532 (#4 most common destination from Modesto)
– Net migration: 1,945 to Modesto

Alan Botting // Wikimedia Commons
#12. Dallas-Fort Worth-Arlington, TX Metro Area
– Migration to Dallas in 2015-2019: 3,481
– Migration from Dallas to San Francisco: 1,188 (#33 most common destination from Dallas)
– Net migration: 2,293 to Dallas
Daniel Orth // Flickr
#11. Riverside-San Bernardino-Ontario, CA Metro Area
– Migration to Riverside in 2015-2019: 3,725
– Migration from Riverside to San Francisco: 2,813 (#7 most common destination from Riverside)
– Net migration: 912 to Riverside
You may also like: Highest-rated pizza restaurants in San Francisco, according to Tripadvisor

Stuart Seeger // Wikicommons
#10. Portland-Vancouver-Hillsboro, OR-WA Metro Area
– Migration to Portland in 2015-2019: 4,217
– Migration from Portland to San Francisco: 1,676 (#10 most common destination from Portland)
– Net migration: 2,541 to Portland
Public Domain
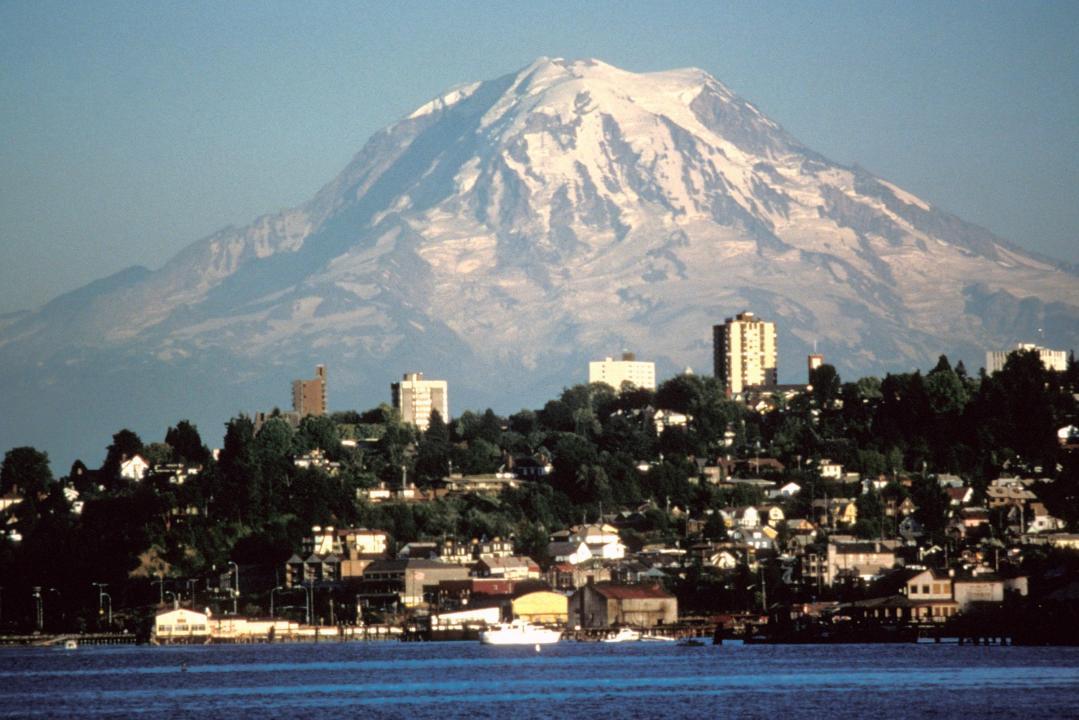
#9. Seattle-Tacoma-Bellevue, WA Metro Area
– Migration to Seattle in 2015-2019: 5,394
– Migration from Seattle to San Francisco: 3,720 (#8 most common destination from Seattle)
– Net migration: 1,674 to Seattle

SD Dirk // Flickr
#8. San Diego-Chula Vista-Carlsbad, CA Metro Area
– Migration to San Diego in 2015-2019: 5,402
– Migration from San Diego to San Francisco: 6,265 (#3 most common destination from San Diego)
– Net migration: 863 to San Francisco

King of Hearts // Wikimedia
#7. New York-Newark-Jersey City, NY-NJ-PA Metro Area
– Migration to New York in 2015-2019: 6,327
– Migration from New York to San Francisco: 9,349 (#14 most common destination from New York)
– Net migration: 3,022 to San Francisco
Matt314 // Wikicommons
#6. Santa Rosa-Petaluma, CA Metro Area
– Migration to Santa Rosa in 2015-2019: 6,515
– Migration from Santa Rosa to San Francisco: 3,676 (#1 most common destination from Santa Rosa)
– Net migration: 2,839 to Santa Rosa
You may also like: Highest-rated Asian restaurants in San Francisco, according to Tripadvisor

California Droning // Shutterstock
#5. Vallejo, CA Metro Area
– Migration to Vallejo in 2015-2019: 9,909
– Migration from Vallejo to San Francisco: 4,220 (#2 most common destination from Vallejo)
– Net migration: 5,689 to Vallejo
LPS.1 // Wikicommons
#4. Stockton, CA Metro Area
– Migration to Stockton in 2015-2019: 10,599
– Migration from Stockton to San Francisco: 3,945 (#1 most common destination from Stockton)
– Net migration: 6,654 to Stockton
BDS2006 // Wikimedia
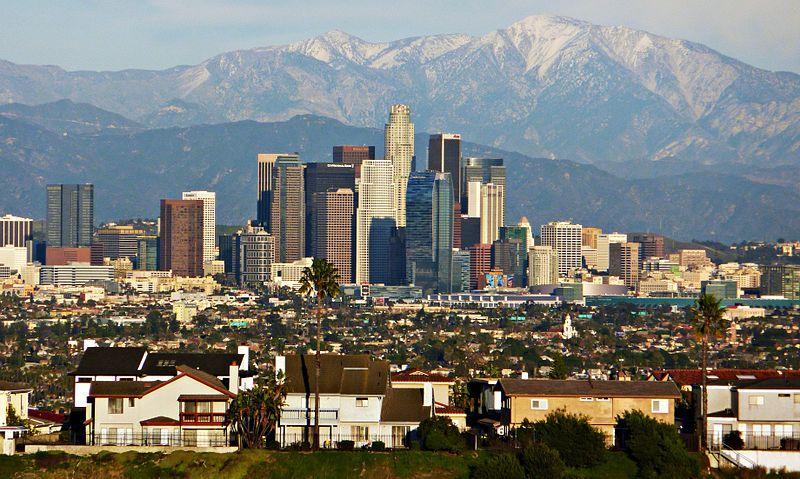
#3. Los Angeles-Long Beach-Anaheim, CA Metro Area
– Migration to Los Angeles in 2015-2019: 16,425
– Migration from Los Angeles to San Francisco: 19,738 (#2 most common destination from Los Angeles)
– Net migration: 3,313 to San Francisco
Pixabay
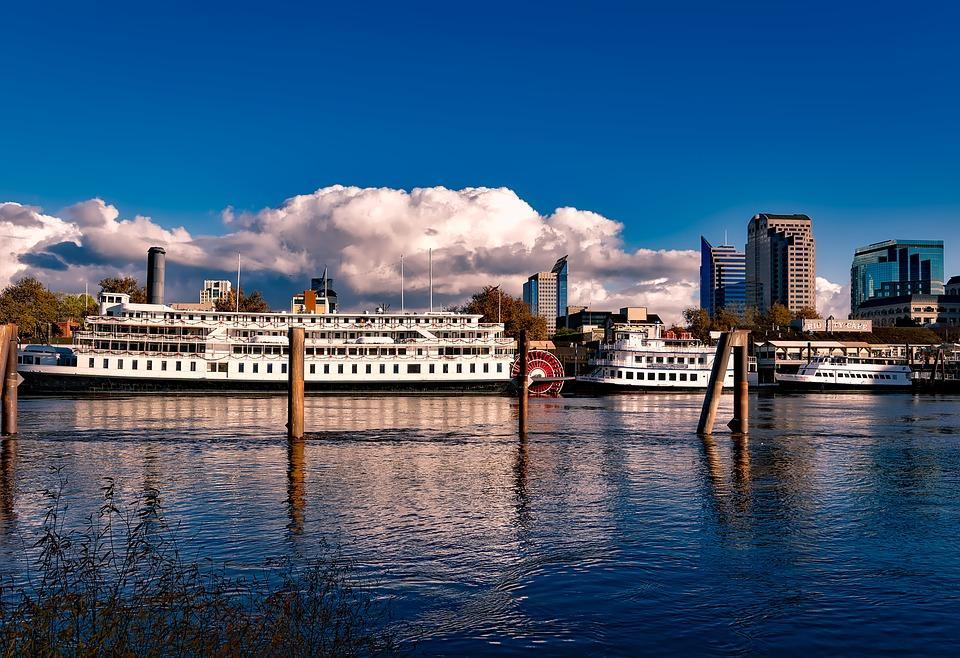
#2. Sacramento-Roseville-Folsom, CA Metro Area
– Migration to Sacramento in 2015-2019: 17,874
– Migration from Sacramento to San Francisco: 9,870 (#1 most common destination from Sacramento)
– Net migration: 8,004 to Sacramento
Don Ramey Logan // Wikicommons
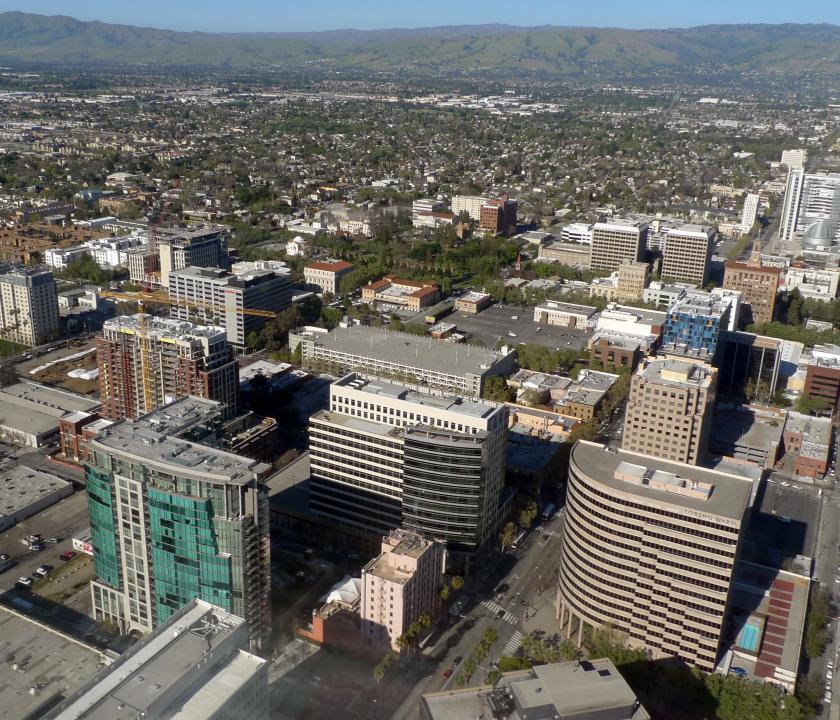
#1. San Jose-Sunnyvale-Santa Clara, CA Metro Area
– Migration to San Jose in 2015-2019: 21,009
– Migration from San Jose to San Francisco: 28,791 (#1 most common destination from San Jose)
– Net migration: 7,782 to San Francisco
You may also like: Highest-rated Mexican restaurants in San Francisco, according to Tripadvisor