These 25 states have seen the biggest increase in fatal auto collisions in the US
Canva
These 25 states have seen the biggest increase in fatal auto collisions in the US
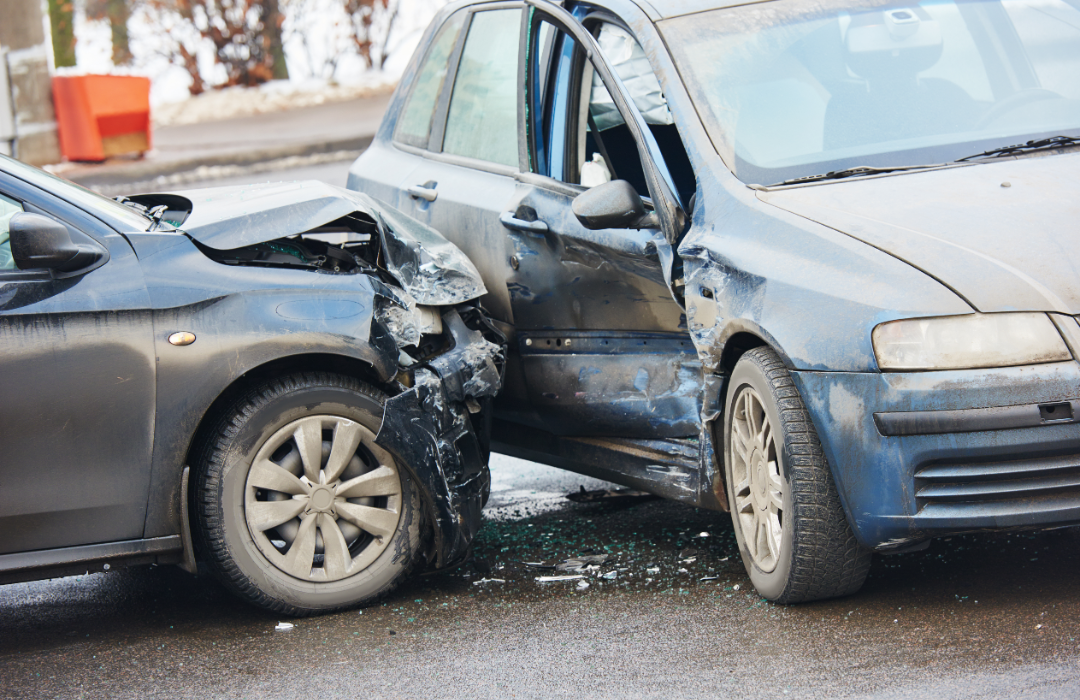
Aftermath of one car crashing into the front-seat passenger side of another car on the street.
During the COVID-19 pandemic, the U.S. experienced an unprecedented increase in fatal traffic collisions. According to National Highway Traffic Safety Administration (NHTSA) data, fatal crashes increased by nearly 17% during the first two years of the pandemic, among the largest two-year increase in history. This sharp rise was punctuated by the deadliest year since 1990, with 39,508 fatal collisions in 2021 alone.
While early estimates for 2022 show that the fatal collisions and roadway deaths have leveled off, they have yet to return to prepandemic levels and remain at historic highs.
Panish | Shea | Boyle | Ravipudi examined three years of fatal collision data from the NHTSA (2019 – 2021) to find out which states experienced the biggest changes and, ultimately, where motorists may be at increased risk of being killed in a crash.
![]()
Panish | Shea | Boyle | Ravipudi
What Drove the Increase in Fatal Car Collisions?
A chart showing fatal collision data from the National Highway Traffic Safety Administration and which states are affected the most.
According to the Government Accountability Office (GAO), during the COVID-19 pandemic years, more drivers may have engaged in riskier behavior such as failure to wear seat belts, speeding, and driving under the influence of alcohol or other drugs. NHTSA data seems to agree with that position. Notably, collisions involving commercial trucks, pedestrians, speed, and alcohol increased sharply between 2019 and 2021.
However, just as the impact of the pandemic was felt differently from region to region, so too was its effect on traffic safety.
Panish | Shea | Boyle | Ravipudi
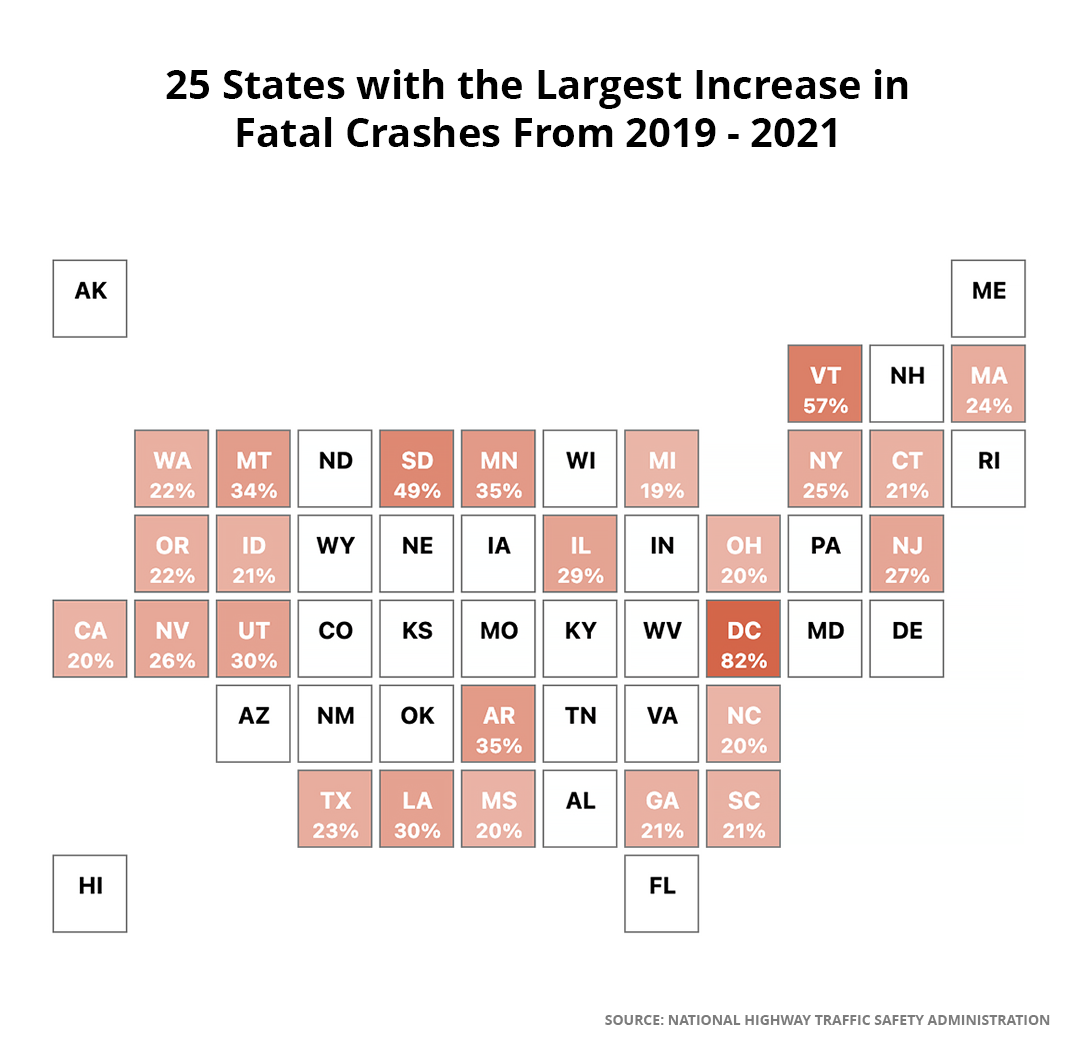
Deadly Car Crashes Increased the Most in These 25 States
A chart showing the top 25 states that saw the most fatalities increase from car crashes.
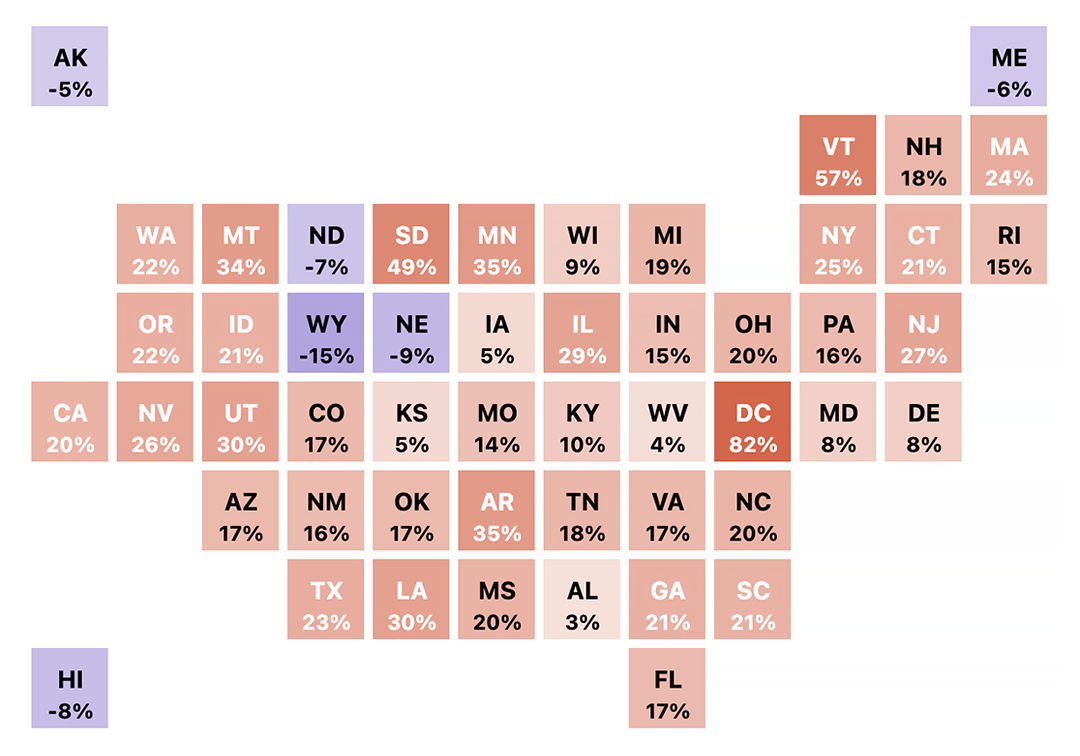
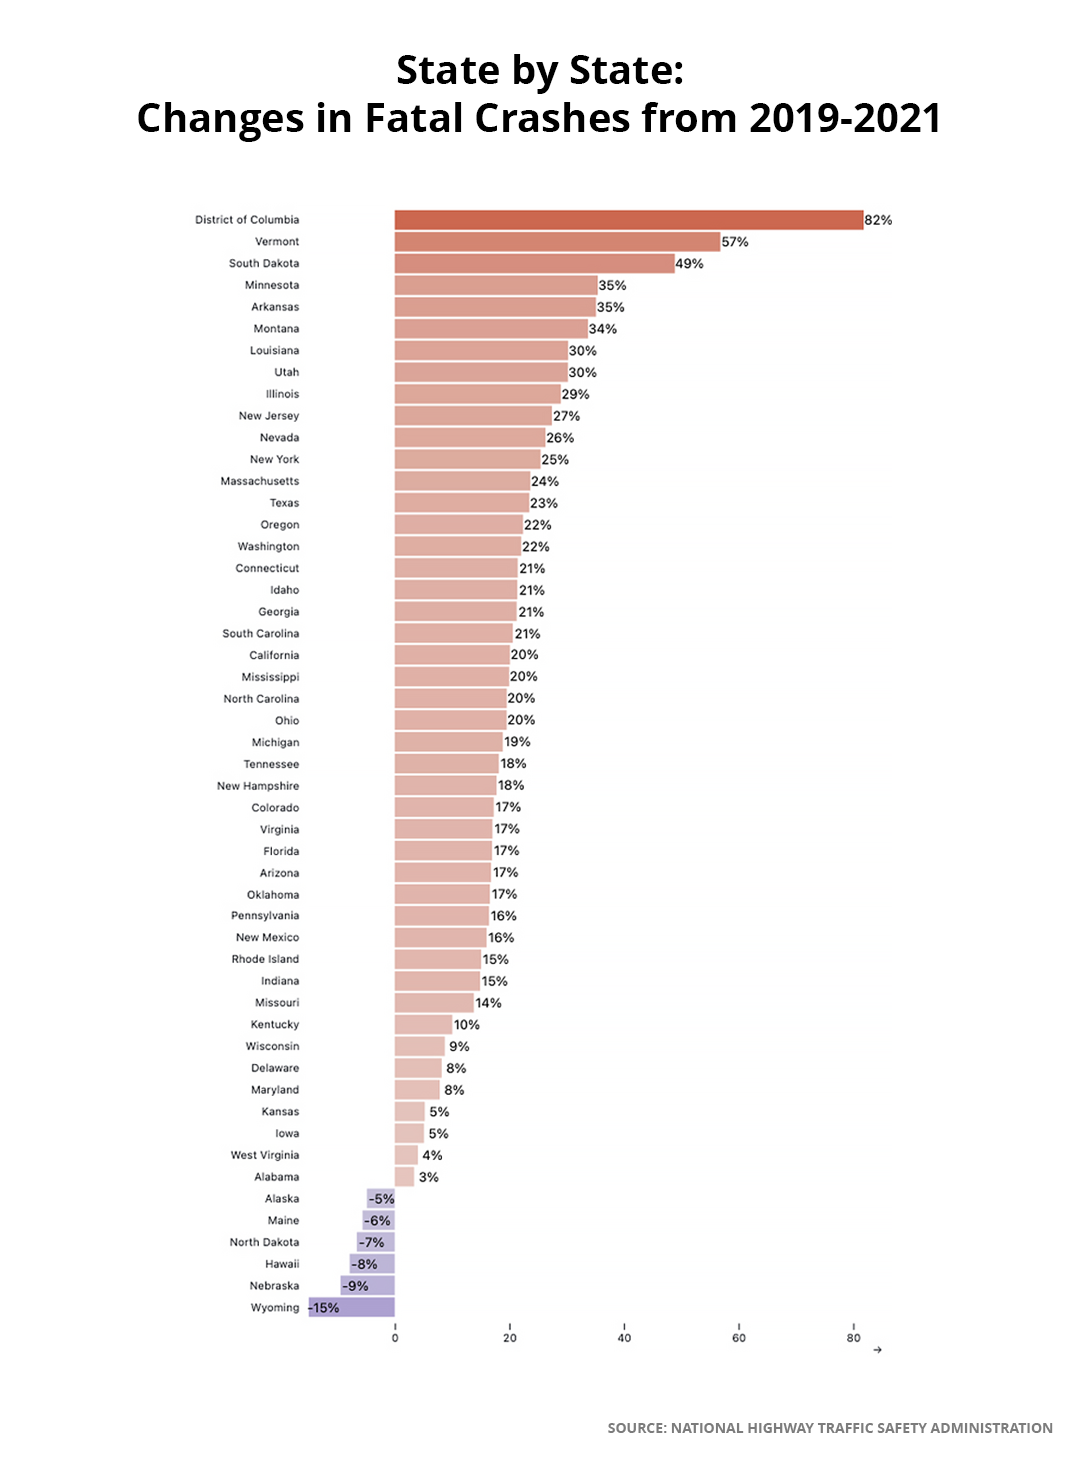
During the observation period, fatal crashes increased in 45 states and the District of Columbia. Of these 25 that had increases greater than the national average of 18%, D.C. led by an increase of 82%, followed by Vermont (57%) and South Dakota (49%).
Panish | Shea | Boyle | Ravipudi
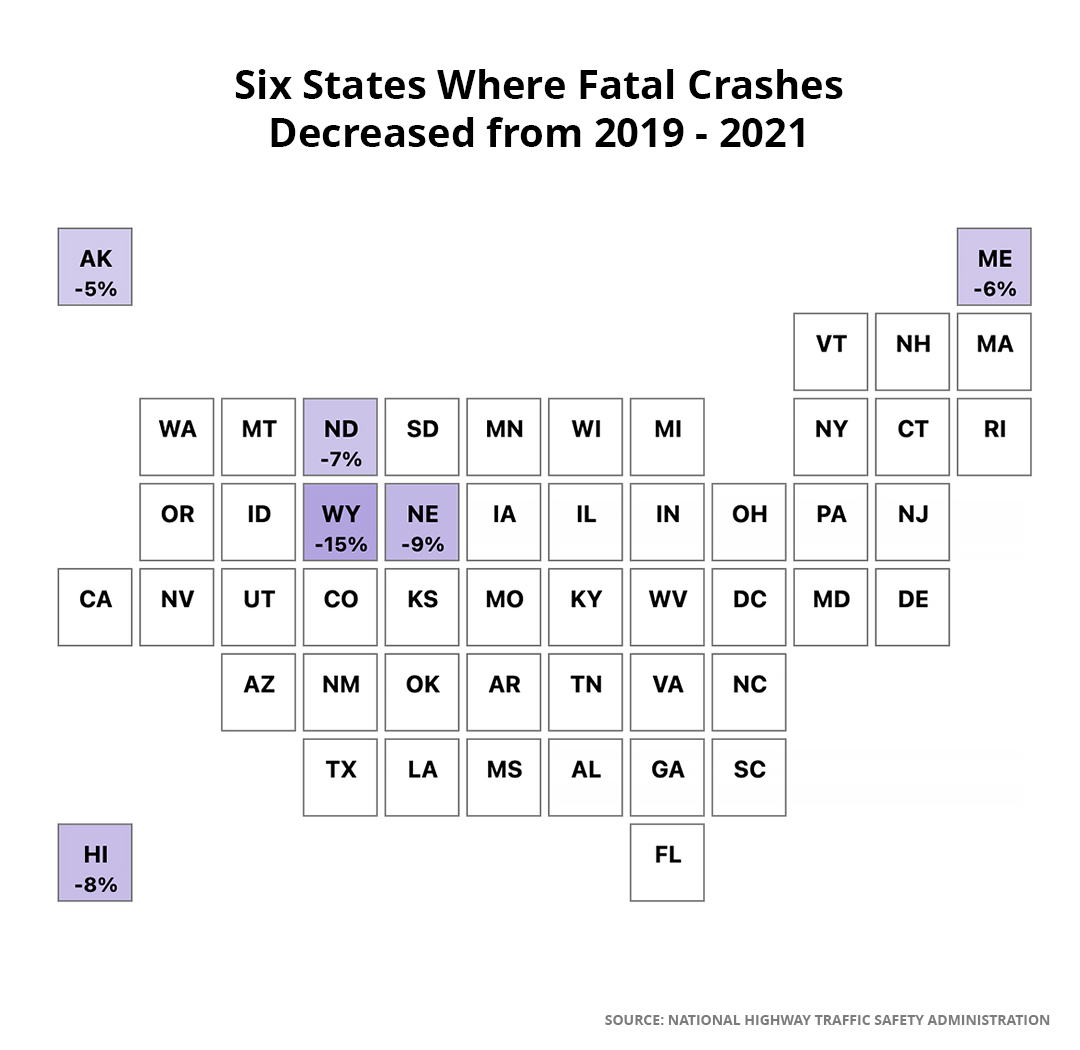
Only Six States Saw a Drop in Car Fatalities
A chart showing the six states that saw a drop in car crash fatalities.
As previously mentioned, only six states experienced a decrease in fatal crashes during this time period. Wyoming led the way with a 15% decrease from 2019, followed by Nebraska (9% decrease), Hawaii (8% decrease), North Dakota (7% decrease), Maine (6% decrease), and Alaska (5% decrease).
Panish | Shea | Boyle | Ravipudi
Comparing Crash Increases for Every State
A bar chart compares every US state and D.C. based on the changes in fatal car crashes.
How does your state measure up? Below, we provide data for every U.S. state and the District of Columbia.
1. District of Columbia
82% increase / +18 crashes
- 2019 – 22 fatal crashes
- 2021 – 40 fatal crashes
2. Vermont
57% increase / +25 crashes
- 2019 – 44 fatal crashes
- 2021 – 69 fatal crashes
3. South Dakota
49% increase / +43 crashes
- 2019 – 88 fatal crashes
- 2021 – 131 fatal crashes
4. Arkansas
35% increase / +164 crashes
- 2019 – 467 fatal crashes
- 2021 – 631 fatal crashes
5. Minnesota
35% increase / +118 crashes
- 2019 – 333 fatal crashes
- 2021 – 451 fatal crashes
6. Montana
34% increase / +56 crashes
- 2019 – 166 fatal crashes
- 2021 – 222 fatal crashes
7. Louisiana
30% increase / +206 crashes
- 2019 – 681 fatal crashes
- 2021 – 887 fatal crashes
8. Utah
30% increase / +68 crashes
- 2019 – 225 fatal crashes
- 2021 – 293 fatal crashes
9. Illinois
29% increase / +272 crashes
- 2019 – 938 fatal crashes
- 2021 – 1210 fatal crashes
10. New Jersey
27% increase / +144 crashes
- 2019 – 525 fatal crashes
- 2021 – 669 fatal crashes
11. Nevada
26% increase / +75 crashes
- 2019 – 285 fatal crashes
- 2021 – 360 fatal crashes
12. New York
25% increase / +223 crashes
- 2019 – 876 fatal crashes
- 2021 – 1,099 fatal crashes
13. Massachusetts
24% increase / +76 crashes
- 2019 – 321 fatal crashes
- 2021 – 397 fatal crashes
14. Texas
23% increase / +774 crashes
- 2019 – 3,294 fatal crashes
- 2021 – 4,068 fatal crashes
15. Washington
22% increase / +109 crashes
- 2019 – 494 fatal crashes
- 2021 – 603 fatal crashes
16. Oregon
22% increase / +101 crashes
- 2019 – 451 fatal crashes
- 2021 – 552 fatal crashes
17. Georgia
21% increase / +293 crashes
- 2019 – 1,377 fatal crashes
- 2021 – 1,670 fatal crashes
18. South Carolina
21% increase / +190 crashes
- 2019 – 922 fatal crashes
- 2021 – 1112 fatal crashes
19. Connecticut
21% increase / +50 crashes
- 2019 – 233 fatal crashes
- 2021 – 283 fatal crashes
20. Idaho
21% increase / +43 crashes
- 2019 – 201 fatal crashes
- 2021 – 244 fatal crashes
21. California
20% increase / +667 crashes
- 2019 – 3,316 fatal crashes
- 2021 – 3,983 fatal crashes
More on the deadliest highways in California
22. North Carolina
20% increase / +251 crashes
- 2019 – 1,284 fatal crashes
- 2021 – 1,535 fatal crashes
23. Ohio
20% increase / +203 crashes
- 2019 – 1,039 fatal crashes
- 2021 – 1,242 fatal crashes
24. Mississippi
20% increase / +116 crashes
- 2019 – 581 fatal crashes
- 2021 – 697 fatal crashes
25. Michigan
19% increase / +170 crashes
- 2019 – 902 fatal crashes
- 2021 – 1,072 fatal crashes
26. Tennessee
18% increase / +189 crashes
- 2019 – 1,040 fatal crashes
- 2021 – 1,229 fatal crashes
27. New Hampshire
18% increase / +16 crashes
- 2019 – 90 fatal crashes
- 2021 – 106 fatal crashes
28. Florida
17% increase / +501 crashes
- 2019 – 2,950 fatal crashes
- 2021 – 3,451 fatal crashes
29. Arizona
17% increase / +153 crashes
- 2019 – 910 fatal crashes
- 2021 – 1,063 fatal crashes
30. Virginia
17% increase / +132 crashes
- 2019 – 774 fatal crashes
- 2021 – 906 fatal crashes
31. Oklahoma
17% increase / +97 crashes
- 2019 – 584 fatal crashes
- 2021 – 681 fatal crashes
32. Colorado
17% increase / +94 crashes
- 2019 – 544 fatal crashes
- 2021 – 638 fatal crashes
33. Pennsylvania
16% increase / +163 crashes
- 2019 – 990 fatal crashes
- 2021 – 1,153 fatal crashes
34. New Mexico
16% increase / +59 crashes
- 2019 – 368 fatal crashes
- 2021 – 427 fatal crashes
35. Indiana
15% increase / +112 crashes
- 2019 – 751 fatal crashes
- 2021 – 863 fatal crashes
36. Rhode Island
15% increase / +8 crashes
- 2019 – 53 fatal crashes
- 2021 – 61 fatal crashes
37. Missouri
14% increase / +113 crashes
- 2019 – 818 fatal crashes
- 2021 – 931 fatal crashes
38. Kentucky
10% increase / +67 crashes
- 2019 – 667 fatal crashes
- 2021 – 734 fatal crashes
39. Wisconsin
9% increase / +46 crashes
- 2019 – 526 fatal crashes
- 2021 – 572 fatal crashes
40. Maryland
8% increase / +38 crashes
- 2019 – 484 fatal crashes
- 2021 – 522 fatal crashes
41. Delaware
8% increase / +10 crashes
- 2019 – 122 fatal crashes
- 2021 – 132 fatal crashes
42. Kansas
5% increase / +19 crashes
- 2019 – 362 fatal crashes
- 2021 – 381 fatal crashes
43. Iowa
5% increase / +16 crashes
- 2019 – 313 fatal crashes
- 2021 – 329 fatal crashes
44. West Virginia
4% increase / +10 crashes
- 2019 – 247 fatal crashes
- 2021 – 257 fatal crashes
45. Alabama
3% increase / +29 crashes
- 2019 – 856 fatal crashes
- 2021 – 885 fatal crashes
46. Alaska
-5% decrease / -5 crashes
- 2019 – 62 fatal crashes
- 2021 – 59 fatal crashes
47. Maine
-6% decrease / -6 crashes
- 2019 – 143 fatal crashes
- 2021 – 135 fatal crashes
48. North Dakota
-7% decrease / -7 crashes
- 2019 – 91 fatal crashes
- 2021 – 85 fatal crashes
49. Hawaii
-8% decrease / -8 crashes
- 2019 – 102 fatal crashes
- 2021 – 94 fatal crashes
50. Nebraska
-9% decrease / -9 crashes
- 2019 – 212 fatal crashes
- 2021 – 192 fatal crashes
51. Wyoming
-15% decrease / -15 crashes
- 2019 – 120 fatal crashes
- 2021 – 102 fatal crashes
How to Use This Information
U.S. Transportation Secretary Pete Buttigieg considers the situation on U.S. roadways to be a national crisis and that the Department of Transportation is working to strengthen transportation safety throughout the country.
“Through our National Roadway Safety Strategy, we’re strengthening traffic safety across the country, and working toward a day when these preventable tragedies are a thing of the past,” Buttigieg said.
However, there are several steps that motorists can take to increase their own traffic safety and avoid a potentially deadly car accident.
- Always wear your safety belt (or wear a helmet while operating a motorcycle or bicycle)
- Avoid driving after using drugs or alcohol
- Don’t text and drive
- Follow speed limits and other traffic control and safety signals
- Be aware of your surroundings and other road motorists
- Watch out for pedestrians
Data & Methodology
This publication is based on an analysis of Fatality Analysis Reporting System (FARS) data provided by the National Highway Traffic Safety Administration (NHTSA) for the years 2019, 2020, and 2021. Rankings are based on the percentage of increase in fatal collisions during the observation period.
This story was produced by Panish | Shea | Boyle | Ravipudi and reviewed and distributed by Stacker Media.